

Utility, Usability and Accessibility Canvas
The canvas helps you assess specific attributes that impact:
Utility - This represents the value to the customer, in other words, how well it solves a customer’s problem and meets their needs.
Usability - Is about how easily a user can achieve their goals.
Accessibility - Accessibility is about designing products and services to meet the needs of people with disabilities. The advice provided is lightweight due to its complexity and importance.
By deep diving into these aspects, a better strategy can be shaped. The overall purpose of the canvas is to be a high-value strategic input. It can help you increase customer satisfaction, avoid churn and create differentiators that can increase sales. It is primarily designed for software-based products and services. You will need to adapt it for other types of products.
The business case for improved experience
Bad experiences will drive customers away. PWC states in their Experience is Everything report that “One in three consumers (32%) say they will walk away from a brand they love after just one bad experience. This figure is even higher in Latin America, at 49%.”.
Inc. quoted the White House Office of Consumer Affairs in this article: “Dissatisfied customers typically tell nine to 15 others about their experience; some tell 20 or more.” This means that not only will you risk early churn of customers, but it can also damage your brand’s reputation and impact future sales.
In this article from the Harvard Business Review: “Acquiring a new customer is anywhere from five to 25 times more expensive than retaining an existing one.”
The importance of utility, usability and accessibility
A common strategy is adding more features to a product to satisfy customers and increase sales. Kano Analysis (see diagram) offers caution to this approach. Referring to the grid, basic needs translate to features in the core product. The curved line represents the customer's opinion based on how well they are implemented. In other words, your product must do the basics well, or customers will be disgusted by your product. Disgust will translate to low sales, low customer satisfaction and churn.
To give a simple example, imagine you have booked a hotel room. There is champagne waiting for you and a sea view. When you take a shower, you realise there's no soap in the dispenser. This causes disgust, and the joy of the champagne is quickly forgotten.
In summary, it is crucial to prioritise addressing customers' major pain points, especially regarding the core product.

Kano Analysis
User experience defined
User experience is the customer’s view of the world. It is about how they interact with your organisation. The picture here shows this. The frontstage is your organisation’s touchpoints. This may be technology, such as a website or a team of people. Below these sit internal teams and technology layers that are hidden from the customer. This is known as the Service Design layer.
This page gives some basic instructions on gathering insights. Customer research can give you “why” something isn’t performing.

Customer Journey Mapping
A Customer Journey represents the series of stages a customer goes through when interacting with your organisation. The canvas can be applied to a customer journey. Below is an overview of customer journey mapping. If you want to create a map, detailed instructions are available here.
Customer journey stages
In the example below, we see an end-to-end journey that starts with the buying process:

Customer journey steps may be unique to each organisation. This is shown in the example university admissions flow below. Each stage can contain a lot of detail, and you may wish to “zoom in” and build out a specific area:

Using the canvas with a journey
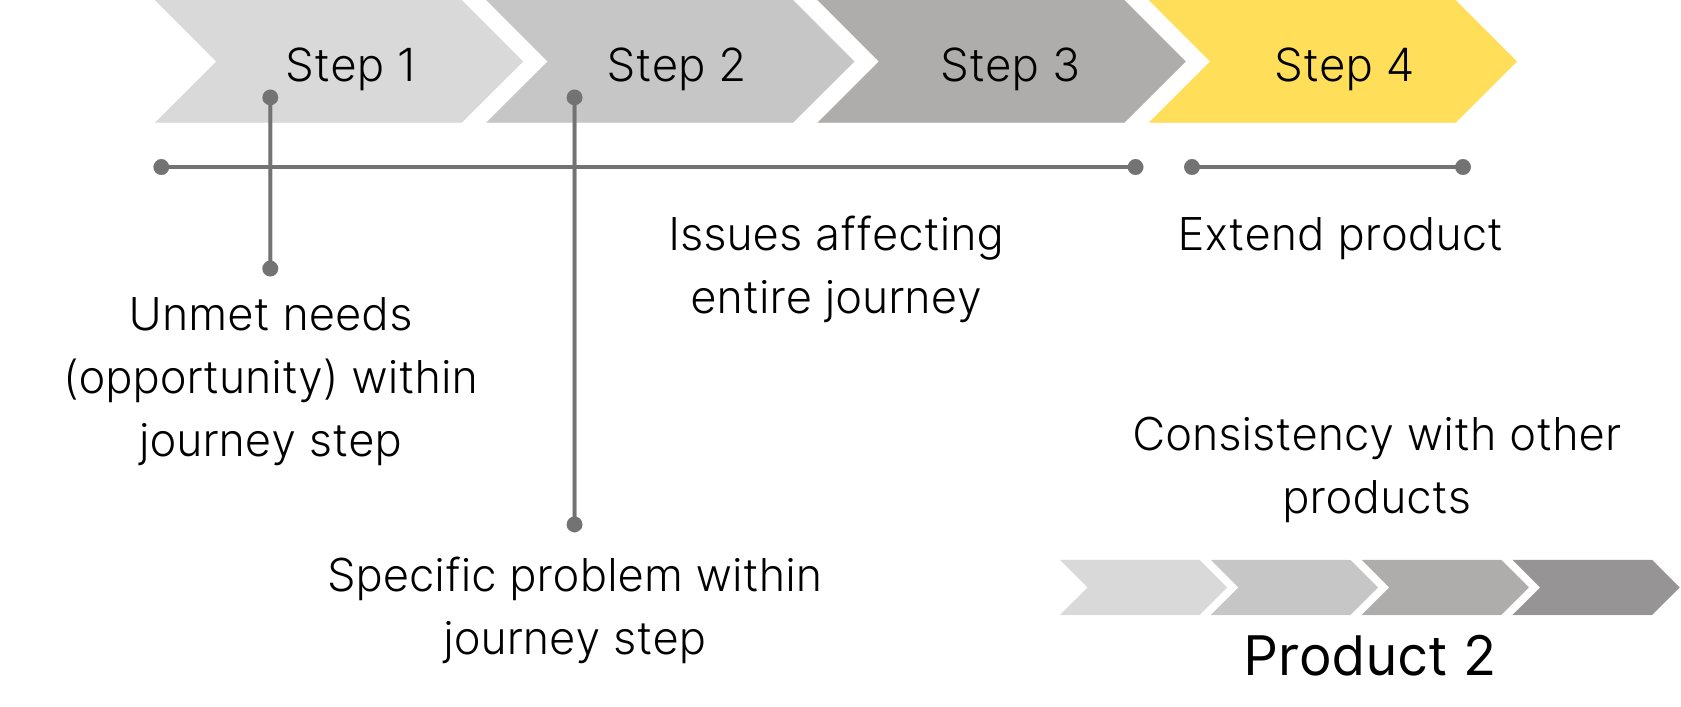
The diagram below shows how issues and opportunities map to a journey. An anti-pattern would be to only focus on these for each individual step.
The canvas without a journey
You may wish to focus on improving customer tasks that don’t contain linear steps. For example, consider the usage journey stage for a graphics program. Apart from loading or creating a new graphic and then modifying it, there is no linear journey. You can perform tasks like adjusting the colours, resizing or adding text in any order. In this case, use the canvas without a journey map.
Utility, Usability and Accessibility Canvas

Feel free to recreate the canvas in a tool of your choice. Please attribute the author (Timothy Field), the source of the canvas (this webpage) and add the CreativeCommons BY-SA license
Strategic priorities and options
Five potential strategic priorities are shown below. Mandatory work should be completed regardless. To decide on which priority to set, start with the Strategic Direction process. For an overview of these, see this page.

With a strategic priority, you can now apply it to the canvas. For example, with the Reduce costs strategy selected, you would ask, “How do I reduce costs by increasing maintainability?”.
Strategy Items
After you have identified issues and opportunities, you will be ready to consider these for your strategy. Strategy Items are high-level options that are ready for prioritisation. Here, we can see an example. The aim of the canvas is not to create one or more for each section. For example, where software quality is poor, the list of issues could be almost endless. You must think carefully about the impact or strategic risk.
You can still keep track of these lower-priority items, but don’t record them on the canvas. More minor issues can often be picked up as part of other changes, such as improving a screen design. See this page for detailed information on Strategy Items.

Utility
Utility represents the value to the customer, in other words, how well it solves a customer’s problem and meets their needs. With these aspects optimised, the customer can spend less time and effort achieving their goals. It consists of the following attributes:
Feature usefulness - The size of the problem to the customer and how effectively you solve it.
Needs met externally - Where customers have to go outside of your service to achieve a goal.
Support services - Where customers can go when they need help.
Supporting content - The resources available to customers, including videos and FAQs.
Personalisation and customisation - Where a customer can tailor the product to meet their specific needs.
Interoperability - The extent to which your product integrates with other products and services.
Reduce sales loss & churn strategy
Losing sales or seeing high customer churn rates may not be attributable to a single usability factor. You may find numerous aspects across a number of product areas. It can be very costly to improve the entire product and, therefore, particularly important to target poor areas. To identify these areas look for:
A large amount of direct feedback about poor quality, support or functional depth.
High numbers of support calls. For example, many customers complaining about a core product feature.
Where you have important features with low usage. This metric will only be applicable where the features are not part of the core product. If they are, the customer will have to use them regardless of their functional depth, and this will not show up as a problem.
Other strategies
Options are included for each utility factor. These can be used as a starting point. You don’t need to create Strategy Items for all of these. Look for those you think will be high impact.
Feature usefulness
Feature usefulness relates to how well a feature solves a customer’s problem. Let’s use an example of a hotel booking mobile app. I want to book a hotel, but the application doesn’t give me a map of where each is. I can’t see how far away each one is from my train station, and I have to work this out manually. As this is a core requirement, I may delete the app and use a competitor. With low usefulness, you may see the following:
With features that are part of the core product, customers:
May not buy from you.
Will churn quickly.
With features that are not part of the core product, customers:
Will not use them.
Will seek alternative solutions that could result in them trying your competitors.
Consider automating these metrics to determine usefulness:
Feature adoption rate - How many users engage at least once. If this is low, your feature may be low value or hard to find.
Feature completion rate - How many users complete a key action. For example, finishing a form.
Usage frequency - How often users engage with a feature. For example, you have 30% that use the feature daily.
If you cannot make a feature useful for a reasonable cost, you should consider removing it. For example, you have written a reports engine but cannot compete with the new ones being released in the market.
Summary of strategies
| Feature usefulness | |
|---|---|
| Mandatory Work | Sufficient functionality for customers to meet their own legal and compliance needs. |
| Reduce Costs | Where a lack of feature usefulness leads to you having high support costs. For example, manual workarounds. |
| Reduce Sales Loss & Churn | Where a lack of feature usefulness is impacting sales loss, churn rates or creating major churn risk. |
| Increase Market Share | Where you can increase feature depth to create a new differentiator. |
| New Markets or Products | Repurpose the feature and target a different customer group. |
Needs met externally
Where needs are met outside of your product, this can be exposed by mapping the customer’s journey. For example, a customer is using an external reports engine. This can be due to several factors:
The customer has to perform a task externally due to you not supporting it.
You may have decided not to support it if development, support or switching costs are very high.
The customer wants to do a task externally:
Based on switching costs.
Lack of functionality from your offering.
Lack of knowledge about your offering.
Price of your offering is not competitive.
By seeking to meet these needs, you can find additional opportunities for competitive advantage or growth.
Summary of strategies
| Needs met externally | |
|---|---|
| Mandatory Work | Where you work with third parties and need to update or replace these interfaces. |
| Reduce Costs | Where you are paying external vendors for their service and can do it cheaper yourself. Reduce the time and effort spent co-ordinating between external services or resolving integration issues. |
| Reduce Sales Loss & Churn | Where competitors have a more end-to-end solution that is impacting sales loss, churn rates or creating major churn risk. |
| Increase Market Share | Create a more end-to-end solution to gain a competitive advantage. This can stop customers from needing to use competitors' products. |
| New Markets or Products | There can be major opportunities for new products by providing for more of the end-to-end customer journey. |
Support services
Increasing usability can reduce the need for supporting services. With even the best design, customers sometimes need help. How a customer is supported can be as important as the product itself.
The Harvard Business Review found that providing excellent support increases customer retention by 5%, which can boost profits by 25% to 95%
Summary of strategies
| Support services | |
|---|---|
| Mandatory Work | Compliance with industry regulations for support and system availability SLAs. |
| Reduce Costs | Where defects, feature depth or system availability result in high maintenance and support costs. |
| Reduce Sales Loss & Churn | Where poor quality support services are impacting sales loss, churn rates or creating major churn risk. |
| Increase Market Share | Where competitors have poor support and you can gain a competitive advantage. |
| New Markets or Products | Create improved chargaeable support. For example, by offering 24/7 support hours or improved SLAs. |
Supporting content
Including FAQs, guides and videos. This report from Microsoft from 2020 found that the majority of customers want self-service. Microsoft discovered that “86% of respondents expect a self-service option, and two-thirds try self-service first before contacting a live agent”.
Summary of strategies
| Supporting content | |
|---|---|
| Mandatory Work | No direct opportunites associated with this factor. |
| Reduce Costs | Where the poor quality or small amount of supporting content result in expensive support costs. |
| Reduce Sales Loss & Churn | Where issues with supporting content are impacting sales loss, churn rates or creating major churn risk. |
| Increase Market Share | Use high-quality information to attract more customers, build trust and stand out. |
| New Markets or Products | Repackage content into chargable assests or further expand it into ebooks, courses or consulting products. |
Personalisation and customisation
These two aspects can give the customer a better experience:
Personalisation is business-initiated. Customers receive a tailored experience based on behaviour and preferences.
Customisation is user-initiated. Customers can change the product to suit their needs.
Personalisation
A tailored experience for customers driven by the organisation. This starts with gathering data points on them. Machine Learning (ML) and AI can provide the engine to analyse the data and act. According to this Forbes article, “Companies excelling in personalization generate 40% more revenue than those that do not, highlighting the financial benefits of tailored financial services.” In this article, McKinsey found that “Personalization drives performance and better customer outcomes. Companies that grow faster drive 40 percent more of their revenue from personalization than their slower-growing counterparts.”
Here are some implementation examples:
E-commerce - This includes showing customers relevant products and giving offers based on previous purchases and store viewing history.
Healthcare - This includes specific advice being sent to patients based on their medical history and conditions. For example, how to actively treat back pain and avoid surgery. This article from BCG provides more detail. “In just 6 to 12 months, some payers that have implemented personalization have seen customer experience improve by 10%, administrative costs drop by 5% to 10%, and quality standards increase by 20% to 25%.”
Customisation
A tailored experience for customers driven by themselves. This experience can boost loyalty as it acts as a source of customer pride. For example, Nike allow you to customise the look of your trainers.
Summary of strategies
| Personalisation and customisation | |
|---|---|
| Mandatory Work | No direct opportunities associated with these factors. |
| Reduce Costs | Where a personalised experience driven by data can reduce the need for manual intervention. |
| Reduce Sales Loss & Churn | Where a lack of personalisation and customisation is impacting sales loss, churn rates or creating major churn risk. |
| Increase Market Share | Personalisation and customisation can act as differentiators and bring a major competitive advantage. |
| New Markets or Products | Create new products that match the needs of a specific customer segment. For example, offer a video streaming service dedicated to science fiction or a software application that shows functionality based on experience level. |
Interoperability
The interface between your product and other systems and applications working together seamlessly. This makes workflows simpler and can eliminate the need for manual data entry.
New products
Interoperability can open up many new product opportunities. It can also create completely new offerings in the market by combining systems and data in ways not done before.
Enhanced personalisation - With more data, you can create better-tailored experiences. For example, you create a health product that tailors advice based on a customer’s shopping and sleeping patterns.
Smart environments - With devices and systems connecting to create integrated homes, cities, and healthcare. For example, you connect your security system to your heating system and turn off the heating when it is activated.
Improved collaboration - Improving teamwork by integrating tools and data. For example, a project management tool that allows you to see the outputs of specific tasks you are tracking.
Summary of strategies
| Interoperability | |
|---|---|
| Mandatory Work | Compliance with industry regulations. |
| Reduce Costs | Where poor interoperability results in high maintenance and support costs. |
| Reduce Sales Loss & Churn | Where a lack of interoperability is impacting sales loss, churn rates or creating major churn risk. |
| Increase Market Share | Where competitors have poor interoperability and you can gain an advantage. |
| New Markets or Products | See the main section text for these. |
Accessibility
Accessibility is about designing products and services to meet the needs of the disabled. It consists of the following categories:
Visual - Blind people or those with poor vision. Solutions include software design aspects such as text size, fonts and contrast.
Auditory - Deaf people or those who are hard of hearing. Solutions include software design aspects like providing captions for videos and improved audio quality.
Motor - People with issues using physical devices, such as difficulties using a mouse or being accurate with a keyboard. Solutions include providing support for specialist input devices and speech recognition software.
Cognitive - People with cognitive impairments such as dementia or autism. They may have issues with memory, problem-solving, understanding and attention. Solutions include software design aspects like consistent navigation and avoiding unnecessary complexity.
Seizures - People with conditions like photosensitive epilepsy. Solutions include software design aspects like avoiding striped patterns, auto-play videos and animated graphics.
The business case for accessibility
In 2016, the Click-Away Pound Survey found that 4 million people abandoned a retail website because of the barriers they encountered, taking with them an estimated spend of £11.75 billion. In 2019, it grew to £17.1 billion.
The World Health Organization estimates that over 1.3 billion people, 15% to 20% of the global population, experience disability.
Your brand perception can be improved by your diversity and inclusion efforts. The Guardian notes that “Ethical consumer spending has hit record levels in the UK, according to a new report that reveals the total market – including food, drinks, clothing, energy and eco-travel – has swelled to over £41bn.”
Non-monetary considerations:
There can be legal implications to ignoring accessibility. For example, in the UK, the public section has to meet accessibility requirements.
Implementing accessibility
The information here is deliberately basic due to the size, complexity and importance of this subject. Before you start, consider the needs of your user base. For example, if you are catering to the visually impaired or those with cognitive disabilities. Please seek professional advice when working in this space.
AbilityNet is a UK-based charity that provides audits and guidance in this space.
W3 is a great place to start to understand the subject better.
Feature usage
Low and high feature usage can give a great indication of how successful individual parts of your product are. Core features that customers have no choice but to use should not be included here.
Lowest usage - Customers do not like this feature (utility or usability issues) or simply cannot find it.
Highest usage - These can provide a competitive advantage. You may wish to invest more in these.
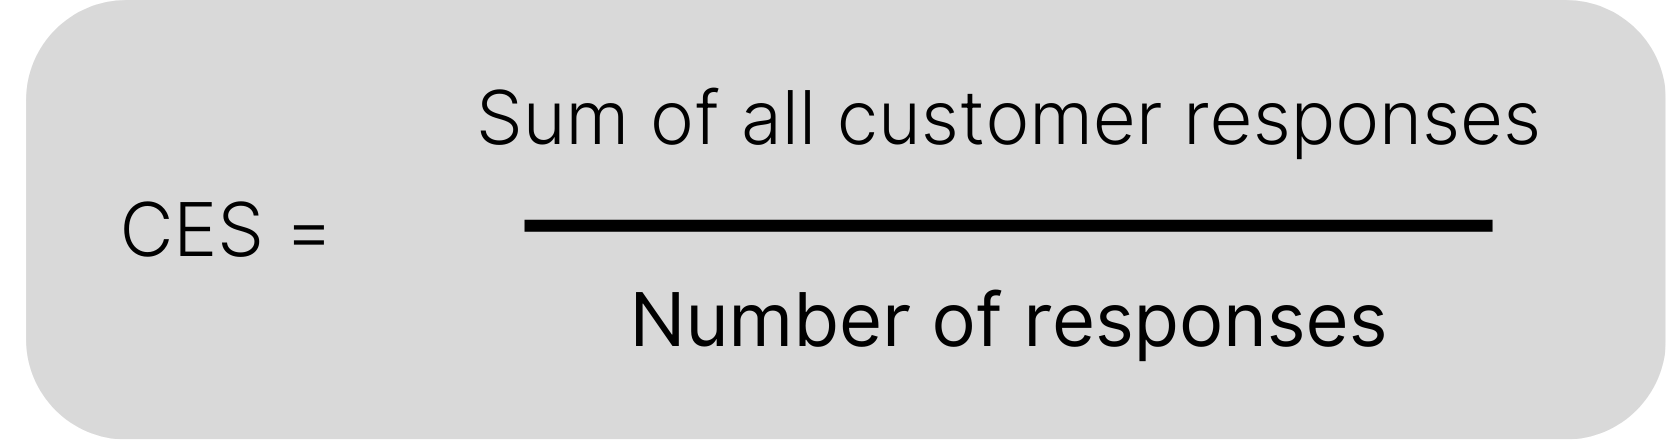
Gathering a Customer Effort Score (CES) for low-usage features can provide additional insights. This measures how easy it is for users to complete a specific task or action. The CES calculation is provided below the feature usage instructions.
Lowest usage features
You should automate usage-level data gathering. The reasons for low usage can be collected in satisfaction surveys, in one-to-ones or focus groups. Always give customers the opportunity to tell you why they answered a particular way. Make sure you intend to do something about these pain points if you ask about them. Continually surveying customers and then making no changes will frustrate them.
Usability issues
You can gauge overall product usability through this simple question. You may need to consider the complexity of the task alongside this. Making a very complex task easy to use can be difficult.
Which areas of the product are hardest to use and why?
Utility
A key aspect of value to a user is utility. This means that the product can achieve what you require of it. This question will pick up users who want your feature but don’t see enough value in it. Customers may use alternative solutions or third-party products when this is not the case. For example, you have poor grammar checking within your word processor, opening the door to competitors.
It is not solving a big enough problem.
It does not fulfil the user’s need.
Users have an alternative solution, such as a third-party product.
Use these questions to discover utility issues:
Which areas of the product don’t do what you need?
What do you need them to do?
Take action
Feature bloat is a very real issue for mature products. Having many features that are of low value can make a product unwieldy, hard to learn and expensive to maintain. You, therefore, have the options of:
Removal - The cost of a feature is not just its build. You also need to support and maintain it. Consider this where the feature is low value and cannot easily be improved. Value can change over time. For example, you release a reports engine that many customers are using. Competitors then create more and more complex alternatives that you cannot match.
Hide:
An advanced section for those who want to see it.
Hidden from all but a specific type of user.
Charge for features where only a few niche customers will want them. This is especially important where a few customers are finding a feature high value, and removing it may cause churn.
Improve the feature - Utility or usability.
Highest usage features
This can suggest features that strongly meet customer needs. This is likely to be very high for the core product. For example, you have a train booking application, and there is a lot of usage of the train time feature. Pay particular attention to those outside of the core product. For example, you see high usage of day trip planning for shows in London. This can present additional expansion opportunities, in the case you team up with a theatre company and offer an all-inclusive ticket.
Customer Effort Score (CES)
CES measures how much effort the customer needs to put in when interacting with a product or service. Ask a question like, “How easy is it to use feature X?".

Other issues and opportunities
Although the canvas covers many areas, you may find additional issues and opportunities that you want to record.
If your priority is to increase market share or create new products, pay particular attention to issues outside of your current product’s capabilities. For example, you transform data, and you discover that customers currently have big issues with data quality. You may then be able to expand your core product, create a paid feature or a brand new product.
Usability
Usability consists of the following attributes:
System Usability Score (SUS) - How customers feel about the usability overall.
Fault tolerance - How errors are avoided or how well they are handled.
Learnability - The speed at which you can achieve a task first time.
Memorability - When returning to a task, how easy it is to pick it back up again.
Efficiency - How quickly experienced users can perform a task after they have learnt it.
In the context of software, good design improves usability and consists of:
User Interface (UI) - The visual aspects of design. For example, the colour scheme, fonts and buttons. It is about creating an intuitive experience for the user.
User Experience Design (UXD) - This is not about visual aspects. It is about how the product functions. The Interaction Design Foundation summarises Interaction Design as “The goal of creating products that enable the user to achieve their objective(s) in the best way possible.”
When conducting usability testing on new features, consider doing this with five new users. Jakob Nielsen, the founder of NN Group, first proposed this in his article 'Why You Only Need to Test with 5 Users' (2000). He concluded that this would pick up 85% of usability issues.
The business case for usability
Forrester in their paid report by Peter Eckert, says that every dollar invested in UX brings between 2 to 100 in return.
The Design Management Institute’s 2015 Design Value Index (DVI), based on a portfolio of 16 publicly traded stocks from companies considered to be “design-centric” contingent on a set of criteria that reflects best practices in design management, shows a 211% return over the S&P 500.
System Usability Score
To measure usability, use the System Usability Score (SUS). This is an excellent Key Performance Indicator (KPI) for the user’s overall experience.
Additionally, you can gauge overall product usability through this simple question:
Which areas of the product are hardest to use and why?
You may need to consider the complexity of the task alongside this. Making a very complex task easy to use can be difficult.
Fault tolerance
Task efficiency is directly related to errors and how they are handled. This is because dealing with errors, you will need to correct them, and that takes time. In some cases, this will be a simple correction, and in others, extensive support may be required. Another significant impact is when customers abandon a task. You should consider both the number and impact of errors. For example, you may get relatively few people failing a security check, but this could represent several days of work to correct. Consider the following interventions:
Prevent errors. For example, if inputting a date, ensure it must be in the correct format. Always seek to prevent errors rather than handle them.
Reduce the likelihood of errors by improving your product design. This stops users from attempting tasks in an unstructured and inefficient way
Improve error messages to help people debug their issues
Task learnability
This usability aspect considers how easy it is to achieve a task the first time. Elon Musk nicely sums up the goal of learnability in this quote, “Any product that needs a manual is broken”.
Self-service considerations
Self-service is where a customer can evaluate and purchase a product without the need to interact with an organisation’s employees. If you offer a free trial of your product as part of this, learnability will be extremely important. Having users unaided on a difficult to use system that are evaluating for purchase is very high risk and can lead to a loss of sales. This is especially relevant to complex systems and low-skilled users.
A formal usability assessment should be undertaken before taking a self-service approach, especially in a low-volume, high-value business-to-business (B2B) environment. You may not only lose sales, but potential customers may no longer be willing to talk to you. Finally, consider the additional risk of easy-to-use competitor products.
Impact of poor learnability
Poor learnability can cause:
High numbers of support requests, including the need for support team intervention
High levels of access to knowledge bases
High training costs
Low user satisfaction
Customer learning
Users don’t begin by trying to learn your product, they start by trying to fulfil a goal. This means they typically won’t study the manual before they start. They will use the user interface until they get stuck or give up.
Measuring learnability
Record the time-on-task for a number of users. Look at the average of these and analyse any poor outliers. For example, when someone has taken twice the normal amount of time to do the task.
Record the number of errors each user encounters. Identify errors that are high-cost or frequently occur.
Improving learnability
To improve learnability, consider techniques like:
Hiding more advanced detail
Giving feedback on task progress, such as text or animation
Lowering the number of process steps
Improve the way you display information. Consider visualisations rather than text, such as those commonly used in train booking applications.
Creating tooltips
Use natural mapping. This is where a control matches what you expect it to do. For example, when you turn a knob to the right, you expect values to go up. Also, consider colours. Green represents go or success, and red represents stop or an error.
Set up wizards
Task memorability
Memorability relates to how quickly a user can pick up a task again that they have previously done. If a system is hard to use, you may find that it is not just learners that struggle. The need to recall the task depends on typical product usage frequency. This could be an annual tax return or a daily check of emails.
Improving memorability
There are two important terms to consider here:
Recall - Imagine Microsoft Word with only shortcut keys. You would then need to recall (remember) the information each time to use the system. Or you’d have to go and look up a knowledge base to help you, which can be very slow.
Recognition - This is where interfaces give you visual and textual information to help you remember. This includes aspects like standardised icons. Another example of recognition best practice is to keep relevant information visible as users work through a task. They should not have to remember details as they go, such as only seeing instructions in step one of a process.
In design, helping users with recognition is much better than asking them to rely on recall.
Measuring memorability
Recall testing is where you ask users to recall specific actions or information they came across in a task. You can ask them to detail the steps they went through or details of messages they saw. These tests can be done with:
Mock-ups or screenshots
In a verbal format
In written format
Task efficiency
An experienced user may still spend a long time on a task, which would suggest it isn’t efficient. If you are measuring this and discover poor performance, you must discover why. There could be a specific step that is difficult or an overly complex process.
Trade-offs with learnability
For new users, being hand-held through a process to improve learnability, such as using a wizard, is an option. However, there is a task efficiency trade-off. You may be unable to speed up the process, leading to low overall efficiency. The wizard is now holding you back. To counter this, accelerators for expert users should be considered. As a very simple example, let’s say I’m copying text in Microsoft Word. I can go through the menu and do this. Alternatively, I can use the CTRL-C key combination, which is much faster. Accelerators include:
Keyboard shortcuts
Mouse
Dedicated devices such as the Elgato Stream Deck
Voice input
Measuring efficiency
Record the time-on-task for a number of users over time. When users reach an expert level, they will reach a maximum speed.
Improving task efficiency
These solutions can improve task efficiency:
Providing accelerators as described above
Simplifying the task. Start by modelling the task out visually to see how efficient it is. You can use a User Flow Diagram for this.
Providing better guidance
Having an undo function
Improving error handling
Summary of usability strategies
Options are included for each strategy and these can be used as a starting point. You don’t need to create Strategy Items for all of these. Look for those you think will be high impact.
| Usability | |
|---|---|
| Mandatory Work | Compliance with industry regulations. |
| Reduce Costs | Areas of high cost due to training and support. |
| Reduce Sales Loss & Churn | Where usability is impacting sales loss, churn or creating significant churn risk. Where customers who can try your product without personal support aren't buying. |
| Increase Market Share | You can gain a competitive advantage where competitors have poor usability. Where you are limited by the number of new customers you can support. |
| New Markets or Products | No direct opportunities. A high-level of usability can lower adoption barriers, this can accelerate your entry into new markets. |
Software quality
In this section, we will focus on how the different aspects of software quality directly impact the user’s experience. Each section includes “business case” advice to help you justify investing in it as a strategy.
Quality benefits both the customer and your organisation.
In addition to the information here, links are also included to help you gain in-depth subject knowledge. Philip Crosby, in his book Quality is Free, the Art of Making Quality Certain (1980), stated that there is no business case required if you are consistently focused on quality. Quality should be a senior management responsibility, and they should support by providing the necessary time and tools. Quality is part of organisational culture. Philip defined four parts to quality management:
Definition - Quality can be defined as being clear on the requirements and then conforming to these. For example, I require the cancel button to warn you your work will be lost.
The System - Avoid inspecting and fixing as this is expensive. Instead, focus on prevention. As the Lean principle states “Build quality in”.
Performance Standards - Zero defects as a performance standard. In other words, do it right the first time. Although zero defects is a manufacturing aim and is challenging to achieve in software, it is still a good goal. By aiming for defect-free, you will be forced to focus on preventing defects by analysing their root cause.
Measuring Quality - Although there are many ways to measure quality, the most important one is, “How much does it cost you to be bad?”
Philip identified five characteristics of organisations that have problems with quality. Use this list to assess your own maturity and make changes:
There is always something wrong with the product.
They need a follow-up service to correct problems.
They don’t have a performance standard defined.
They don’t know the cost of their poor-quality.
Management does not accept responsibility for quality.
Software quality consists of the following six aspects:

Reliability
This is defined as “The probability for failure-free operation of a program for a specified time under a specified set of operating conditions” (IEEE, 1991; Boland, 2002; Khatatneh and Mustafa, 2009; Musa et al., 1984; Goel et al., 1985). High reliability positively impacts the customer experience:
Reduction in live defects.
Increased value received due to faster releases (reduced work on defects).
Less system downtime (system availability).
Reducing defects
You have two options here, the first retrospectively dealing with areas of poor quality and the second building in quality standards.
Retrospective improvements
Not all organisations are focused enough on reliability and may need to invest in improvements retrospectively. You don’t have to improve all the code, this can be an endless, expensive task. Consider refactoring or rewriting poor-quality code in areas that:
Change frequently.
Are the cause of many issues.
Are going to be extensively changed as part of your strategy.
Build quality in
Test practices like Test Driven Development (TDD) and Behaviour Driven Development (BDD) help improve reliability. These focus on writing the tests first, then the code. BDD is written in a human-readable format, allowing non-technical people to understand and validate business scenarios. The idea is that you should focus on scenarios first and then ensure the code handles them.
Measuring the cost of defects
The % of time lost to defect fixing per project/piece of work.
The % of time teams are spending per month on defect-fixing.
The cost of support team time dealing with live defects.
The business case for reducing defects
Customers will receive the following benefits:
Less time requiring support.
Reduced business impact.
Receive software updates faster.
An experiment by IBM and Microsoft in 2008 showed that teams using TDD had 40% fewer defects than the non-TDD teams. Microsoft had even better results, with 60 to 90% fewer. Source: Nachiappan Nagappan, E. Michael Maximilien, Thirumalesh Bhat, Laurie Williams. Realizing quality improvement through test driven development: results and experiences of four industrial teams. Kluwer Academic Publishers, 2008.
“Several studies have found that 40% to 80% of a typical software project’s budget goes into fixing defects that were created earlier on, in the project development efforts.” - Steve, McConnell - After the Gold Rush: Creating a True Profession of Software Engineering” (Microsoft Press, 1999)
Let’s consider why TDD and BDD work. This shows an ideal flow with developers finding any defects:

Here is the even bigger issue of defects being found in live:

Compare this to the cost of defects being found by the test team:

System availability
Most organisations will have Service Level Agreements (SLAs). These guarantee a level of service quality to a customer and usually include system downtime due to unexpected outages. A more reliable system can be defined as one with a greater time between failures. Breaching SLAs can result in legal issues.
Measuring availability
This article from Atlassian provides a lot of detail. Some key metrics are detailed below:
Mean Time Between Failure (MTBF) - The number of operational hours divided by the number of failures
Rate of Occurrence of Failure (ROCOF) - The ratio of the total number of failures over a length of time (e.g. a month).
Mean Time to Recovery (MTTR) - Total maintenance time divided by the number of incidents. This is your complete recovery process from when an incident is reported to when it is fully tested and signed off as fixed in live.
The business case for availability
This report from Ponemon Institute (2016) calculates the average loss per minute of a system not being available is nearly $9,000. This figure will depend on your organisation. The number, length of time to fix, and severity of issues should be taken into account:
Cost to client
Cost to you
Consider factors like financial loss and reputational damage (Net Promoter Score can be impacted).
Summary of reliability strategies
| Reliability | |
|---|---|
| Mandatory Work | Compliance with industry regulations for system availability SLAs. |
| Reduce Costs | Where defects or system availability result in high maintenance and support costs. |
| Reduce Sales Loss & Churn | Considering the cost to the customer, where defects or system availability are breaching SLAs, impacting sales loss, churn rates or creating major churn risk. |
| Increase Market Share | Where competitors have poor reliability and you can gain an advantage. |
| New Markets or Products | No direct opportunites associated with this factor. |
Maintainability
This is defined as how easy it is to maintain (e.g. defect fix) or evolve (e.g. add to a feature) your software. You may have excellent reliability but with poor maintainability, your development speed will be slow.
Improving maintainability
Tools, such as SonarQube, can perform analysis and metrics reporting. In addition, these can block software releases that don’t meet quality standards.
Code reviews - a manual review by a developer who has not written the code
Pair programming - where two developers work on the code at the same time
This article from Coveros is a great starting point.
Measuring maintainability
Maintainability Index - First proposed by Paul Oman and Jack Hagemeister at the International Conference on Software Maintenance, gives a single measure that includes:
Halstead’s Volume (HV) - In human terms, this considers the amount of information a developer has to take in to understand the meaning of the code
Cyclomatic Complexity (CC) - A measure of complexity that counts the number of paths through the source code
Lines of Code (LOC) - Quantifies the size of the software
% of Comments (perCOM) - A ratio of the amount of comments versus the total number of lines of code
This article from IteratorsHQ provides an excellent summary of the available metrics.
The business case for maintainability
A strategy solely focused on reducing technical debt can actually be an anti-pattern. This can result in years of code refactoring that gives little business value. There are three cases to consider:
Areas where which change frequently.
Where technical debt will slow down your future strategy - You should avoid a separate strategy item. Instead, build this into your solution design.
Where a legacy system with technical debt is holding back your strategy - Consider replacing the system.
Summary of maintainability strategies
| Maintainability | |
|---|---|
| Mandatory Work | Ensure adherence to quality standard compliance. |
| Reduce Costs | High development and bug fixing costs. |
| Reduce Sales Loss & Churn | Where you are losing business due to slow defect fixing or feature development. Competitors are able to release much faster or be running with less people at a lower cost. |
| Increase Market Share | Where competitors are slow at defect fixing or feature development. |
| New Markets or Products | No direct opportunities but can enable faster development of new work. |
Compatibility
This is defined as how well the software runs on a variety of operating systems, software systems, networks, devices and browsers (where relevant). An example compatibility test would be ensuring several different database versions work with your software. There are two types of test:
Backward compatibility, which is checking whether older versions of your software still run on the latest software and hardware
Forward compatibility, which is checking whether the new version of your software still runs on older software and hardware
Improving compatibility
Many tools on the market can automate compatibility testing. This will allow automated tests across many different software and hardware versions with vastly reduced time. Rather than needing physical devices, they can emulate these in software. Some have the capability to use your existing Behaviour Driven Development (BDD) tests to check the software functions correctly.
Measuring compatibility
Compatibility reports from your testing.
The business case for compatibility
Loss of sales - You should consider the needs of your customer base. If your software doesn’t function properly, you may lose them. When selling in a B2C (Business-to-Customer) environment, you will have little control over what hardware and software they use. In B2B (Business-to-Business), especially with a smaller client base, you may have more control and be able to specify what you are compatible with.
Risk to users - Consider the impact on your customers of your software not working or functioning properly. For example, the effect of a fire alerting system not working.
Summary of compatibility strategies
| Compatibility | |
|---|---|
| Mandatory Work | Vital for mission critical systems where you have no direct control over customer ecosystems |
| Reduce Costs | Where compatibility issues frequently result in high maintenance and support costs. |
| Reduce Sales Loss & Churn | Where compatibility issues are impacting sales loss, churn or creating major churn risk. Where you have little control of where the customer runs your software. |
| Increase Market Share | Where competitors have poor compatibility leading to low customer satisfaction and you can gain an advantage. |
| New Markets or Products | No direct opportunities. |
Performance
This is defined as the speed and responsiveness of a software system:
Processing time (speed) - How quickly a system can perform a task
Response time - How quickly a system responds to a user
This section also includes scalability. This is the ability of a system to handle an increased load without an impact on performance. This can include increased users, transactions and data volume.
Improving performance
Performance is not always a symptom of poor coding. It can also be a result of resource utilisation and architectural issues.
There are two main approaches to improving performance before the software is released:
Performance testing - This is typically undertaken after the functional testing is completed
Performance engineering - This is the practice of moving responsibilities into the development process, starting with requirements and design. This is highly desirable as correcting a poor design decision after the software has been built can be very expensive.
Fixing performance issues faster in live:
Diagnose issues in live environments with performance monitoring tools like DynaTrace. These can help trace the source of complex performance issues that, in some cases, may not be happening in pre-production environments. In addition, these tools can run on pre-production environments and highlight issues when functional testing is taking place.
This article by DeviQA provides further detail on performance testing and this one by Softteco explains performance engineering.
Measuring performance
Performance Non-Functional Requirements (NFRs) should be defined as part of your development process. You then have a benchmark for your performance testing. For example, during your busiest period, you expect 300 users. You can then load test processes at this rate and higher to see when the system stops performing.
NFRs include:
Processing time - How quickly a system should perform a task. For example, the time it takes to update an operating system
Response time - How quickly a system should respond to the user. For example, being informed immediately that your operating system update has started
Load - The maximum number of concurrent users or processes the system should be able to cope with
Throughput - The rate at which a specific volume of work can be processed over a time period. The time period is typically in seconds.
Scalability NFRs include:
Throughput scaling - The ability of the system to cope with future increases in load without performance degradation. For example, the organisation grows and requires the system to be performant with 10,000 users. You should take into account future requirements and peak load.
Response time under load - The ability of the system to maintain expected response times under high load conditions.
Auto scaling response time - The ability of the system to scale quickly with unexpected load spikes.
The business case for performance
Cost reduction - With modern cloud computing, performance can scale automatically and negate the impact to the user. The problem with this is the cost of scaling.
This excellent article by Jakob Neilsen demonstrates the impact of slow response times on websites:
0.1 seconds gives the feeling of instantaneous response
1 second keeps the user's flow of thought seamless
10 seconds keeps the user's attention. Users definitely feel at the mercy of the computer and wish it was faster, but they can handle it.
A 10-second delay will often make users leave a site immediately
Google found the following, as detailed in this mobile device report:
53% of mobile site visitors leave a page that takes longer than three seconds to load
As page load time goes from one second to seven seconds, the probability of a mobile site visitor bouncing increases 113%
Summary of performance strategies
| Performance | |
|---|---|
| Mandatory Work | Where you are not meeting SLAs or industry performance standards. |
| Reduce Costs | Where you can optimise your software to reduce hardware resources. |
| Reduce Sales Loss & Churn | Where performance issues are impacting sales loss, churn or creating major churn risk. |
| Increase Market Share | Where competitors have poor system performance and you can gain an advantage. |
| New Markets or Products | No direct opportunities but can allow access to markets that require high performance. |
Security
Software security testing is defined as the process of identifying vulnerabilities to hacking. Here are the types of security testing:
Vulnerability scanning - Using software to automate the identification of vulnerabilities in aspects such as passwords
Penetration testing - Simulation of real-world attacks by security professionals
Code reviews - Manual checking for security vulnerabilities by developers
To learn more about this subject, see this article from Bright.
Improving security
This article from Calsoft gives 15 best practices.
Measuring security
This article from SecurityScoreCard provides 22 different metrics and KPIs you can track. Some key metrics are included below:
Mean Time Between Failure (MTBF) - The number of days divided by the number of failures.
Security incidents reported - The number of incidents reported by your teams.
Breach attempts count - The number of times attackers have attempted to hack you.
The business case for security
It can be argued that security is important for all applications. However, the impact of a data breach can differ greatly. Medical records would carry a much higher impact than the history of takeaway food orders. Security should be based on the cost versus benefit of a solution and risk appetite:
Cost/benefit - The business case for improved security activities based on reduced benefits outweighing the costs:
Where there have been security incidents and monetary loss has occurred.
Costs can also include extra development effort and production release delays. These can be due to unoptimised development processes, manual testing and slow sign-off from security teams. Solutions include automated tools to replace manual activities and outsourcing security testing.
Risk appetite - Where possible, use cost/benefit and quantify the impact. For example, quantify the legal fines for non-compliance or the number of customers lost to a similar competitor’s incident.
Summary of security strategies
| Security | |
|---|---|
| Mandatory Work | Compliance with data protection laws (e.g. GDPR, HIPAA). |
| Reduce Costs | The cost of a security breach to you, including fines, downtime and reputation. |
| Reduce Sales Loss & Churn | Where security issues could, or are likely to, impact sales loss, churn, or creating a significant churn risk. Also consider the cost the customer of data loss. |
| Increase Market Share | Where your customers are security-conscious and will choose safer products. Consider this strategy where competitors have had security issues. |
| New Markets or Products | Can give your product access to markets that require high security. |
Portability
Software portability refers to the ability of software to be used across different environments or platforms without significant re-engineering. This includes hardware platforms, operating systems, and software ecosystems. For example, being able to use a product on both an Apple Mac operating system and Microsoft Windows. If the same code won’t run on both systems, the ease of porting should be considered. This is the amount of effort required to convert it to run on another system.
Improving portability
Use programming languages and tools that are compatible with multiple environments.
Avoid environment-specific features.
Measuring portability
The amount of time required to move the software from one environment or platform to another.
The business case for portability
Reduced cost to customers - They can decide which platform (for example, Mac OS or Microsoft Windows) they want to run your software on. This will save them money if they don’t need to buy new hardware.
Increased sales - Making your product available on more environments increases the number of customers you can reach.
Reduced costs - By avoiding environment-specific features, you can re-use your code with fewer changes.
Summary of portability strategies
| Portability | |
|---|---|
| Mandatory Work | Supports compliance with multi-platform requirements (e.g. government contracts). |
| Reduce Costs | Where it is a high cost to maintain and adapt the software across platforms and ecosystems. |
| Reduce Sales Loss & Churn | Where competitors don't support the platforms and ecosystems you can, it makes it harder for customers to switch to them. |
| Increase Market Share | Reduces the ease and cost of switching from a competitor as customers don't have to implement new platforms and ecosystems. |
| New Markets or Products | Facilitates entry into new platforms and ecosystems (e.g. mobile apps, cloud services). |