

New product generator canvas
This canvas helps you validate and optimise a new product in the market. It should also be used when creating features that carry significant uncertainty in market demand or commercial viability. This can include extending towards a more end-to-end solution. For example, adding a reports engine to a data product. It is primarily focused on digital products and services. For example, a SaaS offering, or insurance purchased and managed online. It may need to be adapted for physical products.
The canvas is not something you sit down and complete in one go. You will revisit and update it as you test assumptions, gather evidence and learn what works. For example, competitor analysis may reveal barriers that force you to change your product, target market or pricing.
Why don’t we just build the product?
New products can carry a great risk of failure. Investment in an innovation process can reduce your costs and waste. “Just building” can lack strategic direction, leading to very high costs, or you can end up releasing something quickly that’s very poor and will almost certainly fail. Every failure started as a “good idea”, even though it wasn’t. By following this innovation process, you can test and learn quickly to validate and improve your business model. Do not be afraid to kill ideas that won’t work. At Booking.com, 70% of product experiments fail to deliver the expected impact, highlighting the challenges in predicting user behaviour and preferences.
Innovation anti-patterns
The organisation avoids innovation:
Loss aversion
We perceive the amount we lose as more important than what we gain. For example, losing £1 is worse than gaining £1. This can lead to less risky innovation, as we want to feel confident about the return we will get before investing. This can result in the organisation stagnating as it puts more and more low-risk changes into its existing business model.
Desire to avoid waste
New ideas can be seen as wasteful if they have a low chance of succeeding.
Prioritising short-term gains
The organisation prefers immediate wins over long-term investment, even if less transformative.
Bad ideas run too long:
Sunk cost fallacy
As we invest more in our idea and it isn’t working, we continue, despite it being better to stop. This is because we see the amount spent as being wasted.
Commitment bias
Our tendency to remain committed to save face and avoid embarrassment.
How to start
It’s advisable to read through the guidance before you start. This will give you a good understanding of how each section works. The questions in the canvas are there as pointers, but a much richer depth of information is also available. After you have read the guide, start with the Process tab below the canvas. Some of the sections require specialist skills. For example, you may require significant technical design work. Make sure you have the right team and stakeholders identified before you start.
Once you have an established product, you can follow the Commercial Product Framework to incrementally improve it.
New Product Generator Canvas
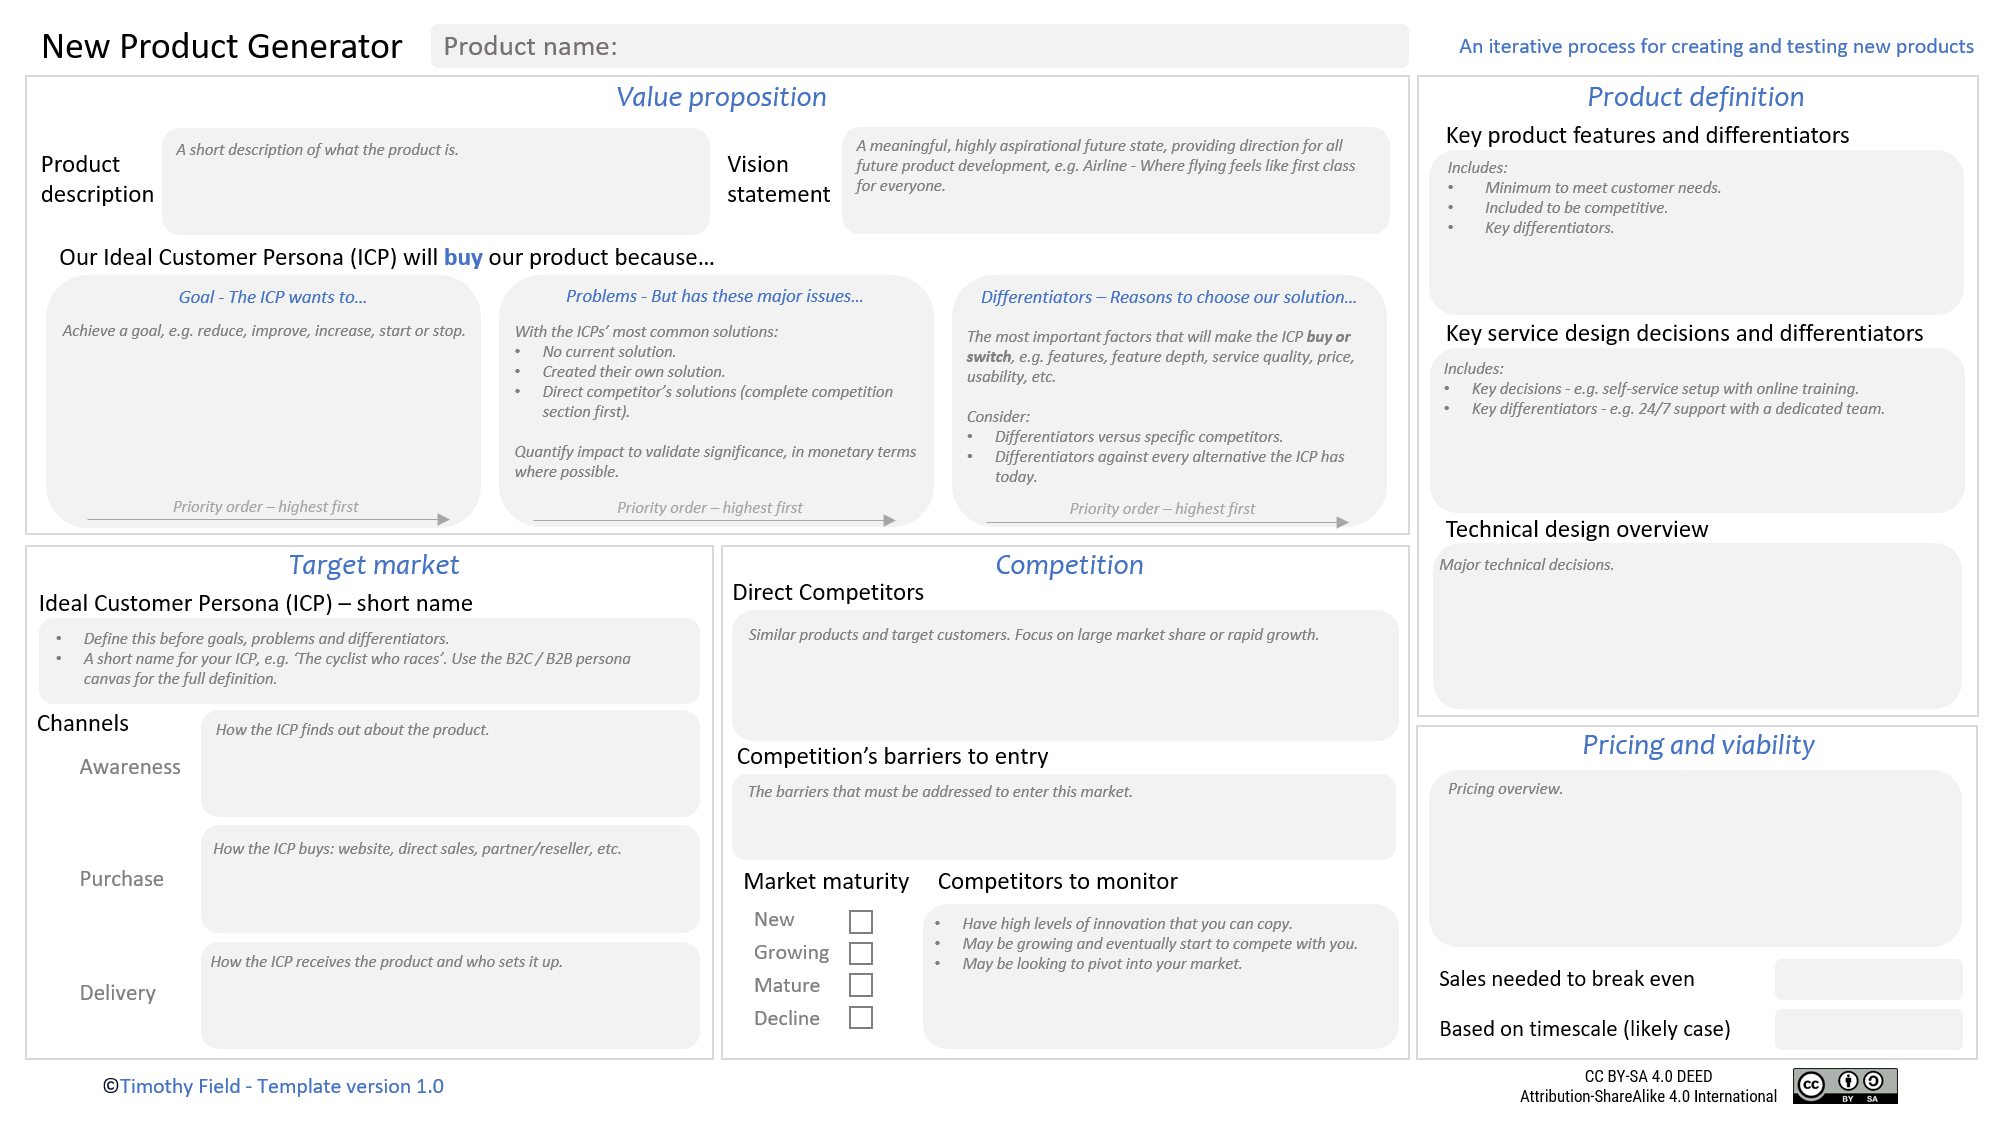
Feel free to recreate the canvas in a tool of your choice. Please attribute the author (Timothy Field), the source of the canvas (this webpage) and add the CreativeCommons BY-SA license
Value proposition
In this canvas section, you are defining why a customer will buy from you. You must consider the many aspects on the canvas to create an effective value proposition. For example, you will not be able to determine your differentiators without understanding the competition.
Product description
This is a short description of the product. For example, if you’re building a new lighter, you could say, "A high-quality metal lighter that’s designed not to go out in the wind”. This doesn’t need to be overly complex, it’s just how you’d describe the product to stakeholders.
Vision Statement
A vision should describe a highly aspirational future state. It will act as the foundation for all future product development.
Your vision will provide direction. Consider these two for an airline company:
Affordable flying that runs like clockwork
Where flying feels like first class for everyone

From these, you would implement very different strategies. It also makes it clear to customers why you exist. Your branding will also need to reflect how you position yourself.
A vision statement consists of:
The benefit or need(s) addressed—the why? The highly aspirational future state
OPTIONAL The target customer—the who? In some cases, you are targeting a specific group
Be careful that your vision statement has real meaning. For example, our mission is “To be the best pensions provider.” This has no real meaning and doesn’t provide a clear aspirational future state.
Why customers will buy from us
This section covers:
Goal - What the customer is trying to achieve.
Problem - The current issues they have with the most common solutions.
Differentiators - We offer these improvements.
Goal
What the customer is trying to achieve is where all solutions start. It is best to frame this with an action. For example, if you are creating a camera for cave diving, the customer’s goal could be to “improve” the clarity of photographs taken in dark underwater caves. Why wouldn’t you write “I want to take better pictures with a new cave camera”? Customers do not want a new product, they want to achieve something. Including the product in the goal is common when you have started with a solution and are looking for a good reason to make it. Let’s use a more detailed example with our cave diving camera product. Consider these three goals:
Increase the number of usable pictures captured per dive.
Improve the quality of pictures taken in dark caves.
Reduce the difficulty of photographing in tight or confined cave passages.
You may be assuming customers have these needs, and need to validate them. Assumptions are dangerous. What if no one wants to take pictures in dark underwater caves, as there is nothing of interest in them? At this point, you should stop your product idea. In some cases, the level of need may vary, so after research, focus on those that matter most to your customers.
Problems
Now you are ready to evaluate the current solutions for weaknesses. They may:
Not have a solution at all.
Have created their own solution.
Be using a competitor’s product.

You should start with the largest part of the market. For example, if 80% of customers have created their own error-prone/high-maintenance solution, then you are off to a good start. Each of these solutions can have its own problems. Below continues the expenses example. Goal - Reduce the time and errors involved in processing employee expenses (for an expenses management software product):
No solution 20% - Expenses aren’t tracked, people email in with requests, and we approve those we think are acceptable.
Problems - We have no control over spending. We cannot budget for expenses. Sometimes, very costly items are approved.
Own solution 20% - Expenses tracked in Excel files.
Problems - The finance team spends hours each month consolidating spreadsheets from different departments. There is no approval workflow, so claims are processed without manager sign-off. Duplicate claims go undetected. When the person who maintains the spreadsheet is away, the process stops.
Expenses functionality in Competitor X 60% - Uses the expenses module within a larger finance platform.
Problems: The expenses module in this case is basic because it is not the vendor's core product. It has the following key problems. Receipt capture is manual. Reporting is limited and cannot be customised.
Quantifying your impact
You need to solve a big enough problem with existing solutions for customers to buy your product. Big is a relative term, but it can usually be quantified. For example, in the no solution category, “Sometimes, very costly items are approved” would be better quantified as “10% of expenses over the expected threshold cost a typical company on average 3 days of discussions per month”. Getting figures is sometimes difficult, but they can be well worth it. It can help customers more easily justify the spend. It can also justify your product to investors.
One of the most effective ways to quantify the impact to customers is using monetary terms. This strongly evidences the value a customer will receive at your price and will strengthen your evidence of willingness-to-pay. In the previous example, you may work out how much the “on average 3 days of discussions per month” costs. Here are three types of cost consideration:
Current cost of the problem - For example, if manual processing costs them £100k per year.
Revenue loss - For example, a company's sales team manually qualifies leads, resulting in 30% of viable opportunities going cold before contact. For a company with £1m in annual sales, this could represent £100k in lost revenue per year.
Monetary risk — For example, the cost of being non-compliant is on average £500k. The risk should take into account probability and impact. Very low probability risks may not resonate.
Differentiators - Reasons to choose our solution
Differentiation is vitally important in a crowded marketplace. Differentiators can be used to:
Increase sales at the same competitor price point.
Justify a higher price.
These can be placed in three categories:
Real differentiators - Solve a problem or create a benefit that the customer actively values. They influence the buying decision, sustain long-term retention, and justify a higher price. It should be noted that price can also be a differentiator, but this should be used carefully as a price war will not benefit you or the competition.
Perceived differentiators - Look good to less experienced buyers who do not yet understand what matters. For example, offering 2GB of storage when competitors offer 1GB sounds impressive, but if no customer ever exceeds 1GB, the difference is meaningless. The customer does not know this yet, so it works initially. Most useful when a large percentage of customers are unskilled. These can be used to counter competitors’ own use of perceived differentiators. For example, they raise the storage to 3GB, and you counter offer 4GB. As customers become more aware, these become a distraction and clutter an offering.
Low value differentiators - These are ones that the customer can immediately see through. For example, offering 24/7 support when your customers rarely need support. Unlike perceived differentiators, these do not even work for less-experienced buyers because the lack of value is obvious. Do not use these.
Focus on the differentiators that have the most influence on the buying decision. This helps with both internal clarity and customer messaging.
A small number of strong differentiators is more effective than a long list including many minor ones.
A large number of strong differentiators will make it difficult for a customer to remember them.
Some differentiators address problems customers don't yet recognise. For example, AI coding tools may further degrade code quality in poorly written code, but customers may not yet see this as an issue. These differentiators could be extremely important, but will require customer education.
Pricing and viability
In this canvas section, you will consider if your idea is commercially viable. Viability means confirming that your product can generate enough revenue to cover its costs and deliver a profit within a realistic timeframe.
When creating a new product, you should determine the point in time at which you expect to reach profitability. This needs to take into account:
Pricing - What price will you charge, and how will you charge it? e.g. £20 a month subscription or £20 per 1GB of database storage. The price and its structure will affect the number of customers and the amount they spend.
Costs - What will it cost to build and run the product? This includes one-off, fixed ongoing and variable ongoing costs.
Customer demand - Will enough customers pay at your price point to cover costs and reach profitability within an acceptable timeframe?
Whenever “customer” is mentioned, it is in the context of the Ideal Customer Profile (ICP) you are targeting. Three break-even analysis methods that account for these factors are provided later on. The first is a basic sense check to see if you should continue. Using predicted numbers and modelling potential scenarios will help you be more realistic.
Customer Lifetime Value (CLV)
CLV is the total profit a customer generates over the lifetime of the relationship. Every decision should be weighed against its impact on CLV, with the goal of maximising it. For example, avoiding charging the highest price you can for the initial sale, when you know it will cause the customer to churn quickly. With CLV in mind, you are aiming for repeat purchases, sustained subscriptions, and potential upsells. You won't have real CLV data for a new product, but for each product, service, and pricing decision, consider how it will impact how long customers stay and what they spend over time.
Cost and customer experience — Reducing costs to improve profitability is tempting, but doing so at the expense of customer experience can shorten customer lifetimes. Customers who churn quickly reduce CLV, and worse, may publicly report a poor experience, deterring new customers.
Pricing strategies — You may decide to implement strategies that delay the point in time you expect to move into profitability but have long-term benefits. For example, using penetration pricing — going in really cheap, combined with creating high switching costs to win a large section of the market, then raising prices when you are established. Even though the break-even timeframe looks unhealthy, it is a deliberate strategy to maximise long-term success.
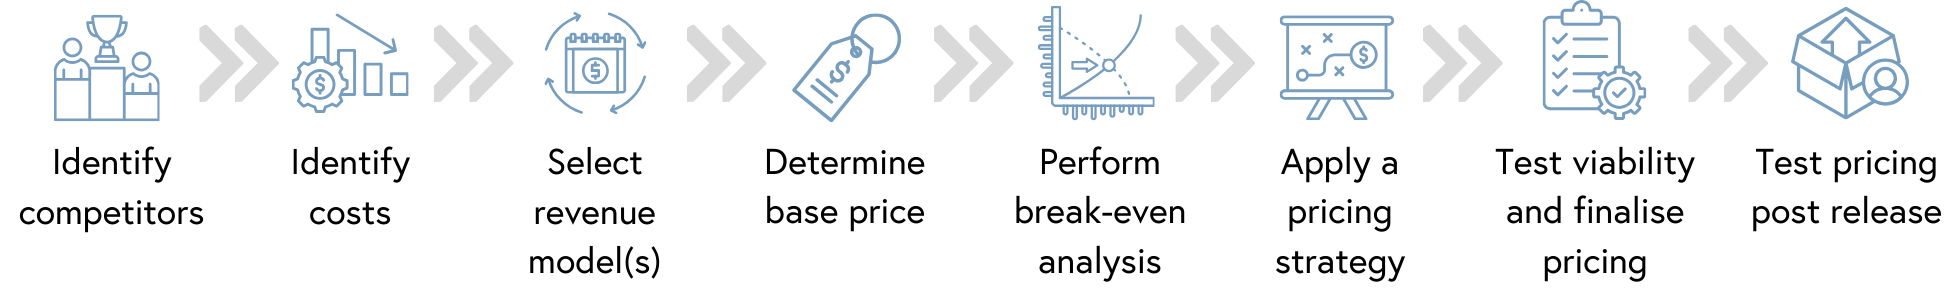
Process overview
The process below is designed as an introduction to pricing. It will help you understand how pricing is determined, but it will not provide all the possible choices you have on aspects like revenue models. It is important to note that there are no industry-standard definitions for the pricing terms used. Common terms without agreed-upon definitions include pricing model, revenue model, and pricing strategy. Taking advice from different sources can be hugely confusing. The process contains the following steps. The first step, identify competitors, should already have been completed on the canvas.
Step 1 - Identify costs
Costs will form the basis of break-even analysis. Cost types and categories are provided below to help you. Let's use a simple example. You have costs associated with a regulatory license. First, you have a one-off cost of £20k to upskill and evidence that you can meet the regulatory requirements. After this, you have a fixed cost of £1k to renew the license certificate.
Types of cost:
One-off costs - Initial costs incurred before or at launch, such as development, equipment, legal setup or initial marketing. These are not recurring but must be recovered through your pricing over time.
Ongoing fixed costs - Recurring costs that remain the same regardless of how much you produce or sell, such as salaries, office space and software licenses.
Ongoing variable costs - Costs that change in proportion to production or sales volume, such as hosting per user, transaction fees, raw materials or per-unit support costs.
Cost categories:
People costs - The people developing, delivering and supporting the product, including salaries, contractors and recruitment.
Technology costs - Licenses, infrastructure, data storage and development tools. Technology can also act as an enabler to reduce costs elsewhere.
Operational costs - Day-to-day activities required to run the product that aren't captured above, such as administration, facilities and insurance.
Marketing and sales costs - Advertising, campaigns, influencers and sales team costs. For new products, customer acquisition cost (CAC) is a critical metric - track what it costs to acquire each customer, not just your total marketing spend.
Supply chain costs - Costs associated with delivering a product or service to your customers, including logistics, packaging and third-party fulfilment.
Regulatory and compliance costs - Certifications, legal requirements, data protection and industry-specific compliance.
Viability considerations
You may make product, service design and technical decisions that significantly impact your costs and need to review them for viability. For example, you have selected a service differentiator to support the product 24/7, but find the costs are too high and will stop you from being competitively priced. Another viability consideration is your competitors' overall costs. They may have economies of scale, meaning you will not be able to match them. In this case, you will have to charge more and rely on differentiation.
Step 2 - Select revenue model
Your revenue model determines how you charge your customers.
Revenue model
Example revenue models are usage-based, subscription, per-user pricing and time and materials:
Core - These are the foundational revenue models for a business, each of which can operate standalone. For example, you could build an entire SaaS company based solely on per-user pricing. There are many options here, including subscription-based, usage-based, per-seat, and transaction-based commission. It is common in SaaS to use a hybrid model combining multiple core models. For example, you have a monthly subscription charge (subscription revenue model) and also charge for data storage space (usage-based revenue model).
Supplementary - You can choose to layer in supplementary offerings, such as a configuration project option with its own price.
Revenue model considerations
Covering costs - Does your revenue model reflect your cost structure? If your costs scale with usage (e.g. storage, compute), a usage-based model aligns revenue with costs. If you charge a flat subscription but your costs increase with usage, heavy users can erode your margins or even bankrupt you.
Customer expectations - How do your customers expect to pay? A B2B enterprise customer may expect annual contracts, while a consumer may expect monthly subscriptions that they can cancel anytime. If your model doesn't match how customers want to buy, you create friction.
Value alignment - Does the model reflect how customers experience value? If your product saves customers money on every transaction, a transaction-based model ties what they pay to what they get. If the value is in always-on access, a subscription makes more sense.
Competitive norms - What models are your competitors using? You don't have to match them, but you need to understand what customers are used to. Departing from the norm could be a differentiator, or it could confuse buyers.
Revenue predictability - Subscription models give predictable recurring revenue. Usage-based models can generate more from high-usage customers, but make forecasting harder.
Revenue model structure
With a revenue model selected, you need to decide how the pricing will work for it. You must decide this for every revenue model. Let’s use a simple example with a single, usage-based revenue model to explain this. You decide to use usage-based pricing for data storage space and are considering two options:
A flat data storage price for everyone - this is simple for customers to understand.
A volume-based discount - you have a number of customers who are growing and want to reward them with cheaper prices as they scale.
Step 3 - Determine base price
At this point, you are looking for a base price that covers your costs, is competitive, and aligns with your customers' perception of value. Having a good view of this starting point will help you perform a more realistic break-even analysis.
Imagine setting your price, only taking costs into account. With a production cost of £3, you set a price of £4. You go to market, and no one will buy from you as your competitors have lower costs and sell at £2. Alternatively, you price at £2 to match competitors, but customers would have paid £5 because your differentiators save them significant time. Do not consider pricing strategies such as penetration pricing yet, these are covered later in the process.
Costs:
Variable ongoing costs - Unit economics evaluates whether the revenue generated from each customer covers the direct costs of serving them. Let’s use a SaaS data storage product example to demonstrate this. We identify that database storage has a high cost of £10 per GB, and customers can use a lot of it. We now need to ensure that pricing covers this cost. We set the price to £11 per GB. If we didn't consider charging for this, we may never break even. If it doesn't, every additional customer loses you money.
Fixed ongoing and one-off costs - Each sale needs to generate sufficient margin to cover your fixed ongoing costs, such as salaries and infrastructure. Finally, you will need time to recover your one-off setup costs. At this stage, you are not doing formal break-even analysis, but you should be able to see whether the base price is in a realistic range. If your variable costs alone push the price above what the market will bear, the model may not work. Your competitors' cost structures matter here too. They may have economies of scale that allow them to price lower than you can. In this case, you will have to charge more and rely on differentiation.
Competitive — Customers will base their understanding of pricing on what your competitors charge. This is known as price anchoring. For example, if a similar product is at £3, a customer will start considering your product based on this. If you ignore this and charge above it, customers may not buy from you.
Customer's perceived value — Customers will make a value judgement to determine what they will pay. They may be willing to pay more if your product offers more value. This is hugely important and links to your value proposition: 1) Are you meeting an important enough goal for your customer? 2) Are you solving big issues with their most common solutions? 3) Are you offering important enough differentiators for them to select you? Quantifying additional value in monetary terms can help you justify a higher price.
Competitive value analysis
The product value analyser is a very simple tool for assessing your offering’s pricing against the competition. It is customers who determine the value of a product. You need to be clear about which differentiators really matter to customers. Consider the value overall rather than evaluating each differentiator individually.
Competitor value - The competitor threat analyser canvas can help you determine the differentiators that affect why they win and lose. In some cases price itself will be a differentiator, with some customers wanting a low-cost product. If you offer enough value to charge more, you will not need to match this. If competitors are charging differently, e.g. per-seat versus usage, work out the typical amount a customer will spend. A customer will be trying to evaluate a product in this way themselves.
Pricing should match the value a product offers:
Pricing too low - The customer may assume you are of low quality.
Pricing just right - The customer understands the value you offer, and this matches the price.
Pricing too high - The customer will hesitate, avoid buying and potentially go with a competitor.
When setting the price by value, you should also consider your costs. You may not be able to afford to set the price point and have to lower costs, change the product or give up on it entirely.

Step 4 - Break-even analysis
Break-even analysis helps you determine how long it will take to be profitable. It can even tell you if your idea won’t work:
Costs are too high based on the maximum price we think we can set.
It will take too long to become profitable based on very little difference between costs and revenue.
Demand is too low to even cover the development costs.
These two fields on the canvas are populated from your analysis:
Sales needed to break even - How many sales I need to cover my start-up, ongoing fixed costs and ongoing variable costs.
Based on timescale - What timescale is this based on? For example, 3, 6 or 12 months. With major investment, this can take years.
The sales figures you enter must be based on evidence. Without this, break-even analysis is meaningless. You can make any product look viable by inflating demand. Use the test viability and finalise pricing section to develop more realistic figures. If you are seeking investment, consider presenting three scenarios: conservative, most likely and optimistic. Investors expect this and will stress-test your assumptions.
Conservative - Lower growth assumptions such as slower customer uptake, higher costs and longer sales cycles.
Most likely/base case - Based on current evidence and reasonable assumptions. Use this on the canvas.
Optimistic - Favourable conditions such as faster growth, higher conversion rates or lower customer acquisition costs.
There are three break-even modelling methods provided:
Basic viability sense check - Do the numbers make sense? Without any detailed modelling, you can consider if this stacks up. If you have startup costs of £60,000 and you know you only have 3 small customers who are interested but won’t pay much, you may stop immediately. To determine this, you may need to conduct some basic customer research.
Project payback period based on cumulative cash flow - This method shows you how long in months it will take to move into profitability. It takes into account "cumulative cash", which starts with your up-front investment. This is particularly relevant to a new company that requires seed funding. If your costs are above your revenue, especially common at the start of a business, this will dip further into the negative.
Break-even point analysis - This method can be used when you have no start-up costs. For example, a development team that is always funded is taking on a large new product feature. Although it does not take into account start-up costs, it gives a richer view of revenue, fixed and variable costs and how they interact.
An Excel file is provided to create the second and third methods described above. Subscription, per-seat and usage tabs are provided for both break-even and cumulative cash flow. Only use the revenue model that applies to you. The instructions below give you an introduction to the methods.
Method one - Basic viability sense check
As the most basic option, you can simply sense check the “Sales needed to break even” figures. For example:
Number of customers - We have 50 clients, 10 have expressed an interest in our new product.
Price - We will charge £5000 per annum for the product.
Start-up costs - The product will cost around £1m to develop before any sales are possible.
Run costs - £1000 per annum for supporting the product.
Break-even point sense check - 10 clients at £5000 = £50,000. I need 200 just to cover my £1m start—up costs, and these sales numbers would be extremely challenging. Even without doing any detailed analysis, I can see that the product will take years before it breaks even. I can now make a quick decision to stop.
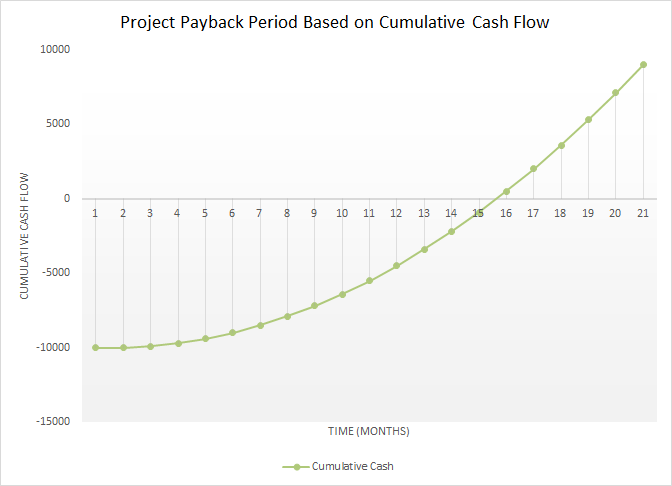
Method two - Project payback period based on cumulative cash flow
The following graph is a method for performing break-even analysis. The graph below is a simple example that begins with start-up costs of £10,000, after which the product moves into profit from month 16. The graph below is based on the following:
Start up Costs = £10000 (this represents a -£10000 cumulative cash figure at month 0)
Monthly Fixed Costs = £100
Variable Cost per Unit = £10
Price Charged per Unit = £20
Step 5 - Apply a pricing strategy
Their overall goal is to help you maximise long-term profit. Each strategy has specific aims, such as helping you be more successful when entering a market. Although some may suggest “everyone uses a pricing strategy”, this is a poor argument. Setting a price is not in itself a strategy. You can apply your selected strategy to your break-even analysis. The implementation of a pricing strategy is optional. Here are three common ones:
Penetration pricing - Going in really cheap, combined with creating high switching costs to win a large section of the market, then raising prices when you are established.
Premium — Using a sustained price above base, justified by brand/exclusivity. Perception of value can be linked to price. A higher price may convey prestige. Lowering prices and discounting can actually damage some brands.
Skimming — Enter high and reduce over time. This strategy is common for new types of product where there is strong demand. As competitor products catch up, there is pressure to lower prices to remain competitive.
Step 6 - Test viability and finalise pricing
You should now have a complete understanding of your pricing ready for testing. For example, you have modelled a usage-based revenue model with a flat fee of £10 per GB of database storage. This uses a penetration pricing strategy to win new customers, since it is much cheaper than the competition. With pricing set, you can undertake viability testing to evidence that you can make sufficient revenue to support your business model. This includes assessing the customer’s willingness to pay.
These techniques aim to determine whether a sufficiently high number of customers will pay for this product to outweigh the cost of building and running it. With your break-even analysis, you should have an idea of how many this will be. For example, do you need to make 100 sales in 6 months to break even?
Internal team assessment
This first check relies on expert opinion. You should do this during the Structure process stage. You should invite senior specialists to review the product.
Value proposition assessment
Review the overall value proposition and focus on the section labelled “Our Ideal Customer Persona (ICP) will buy our product because...”
Have you captured the key reasons, or do you just have a long list?
Is there enough evidence to back up the claims, including any quantification?
Monetary assessment
If you intend to claim benefits in monetary terms, you will need to test the strength of your claims. These can be hard to prove. Do you have strong evidence? Will customers believe you?
Cost reduction - How much money your product can save your customer.
Revenue generation - How much money your product can make for your customer.
Risk/cost avoidance - How much monetary risk can be avoided.
Market size & expected sales
For example, the sales leads may have a strong opinion based on what has been sold before. The picture below shows the considerations:
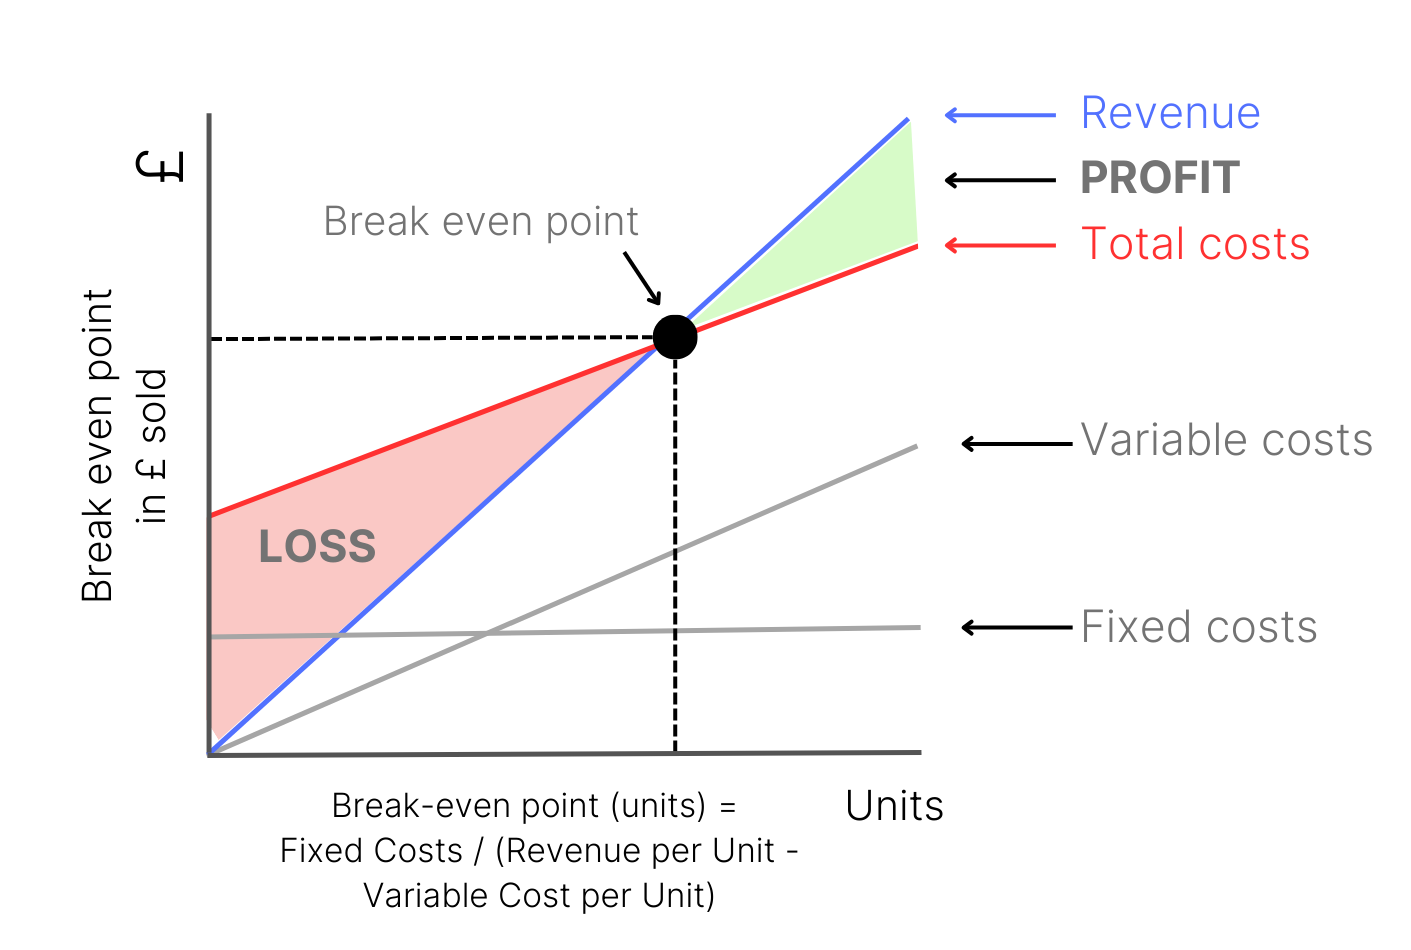
Method three - Break-even point analysis
The following graph illustrates how to perform a more visually rich break-even analysis. The graph below shows the break-even point before a product moves into profit. The graph starts at 0 units sold. Fixed costs are the costs you always have, regardless of the volume sold. For example, you are paying your CEO a salary each month. This type of graph does not include start-up costs and is better suited to tracking progress when operating. For example, you have £1m start-up costs already accounted for and want to track from the point you start trading.
Costs are either:
Fixed - Costs that stay the same regardless of volume, such as licenses for development tools and the cost of the development team.
Variable - Change depending on the amount of production.
For example, fixed costs = £20 per month and variable costs = £10 per unit sold.
As each unit of a product is sold, the revenue starts to burn through the total costs.
Our revenue is based on the price per unit. At a minimum, we need to charge above our variable costs to make a profit:
The price you intend to charge needs to be realistic for your break-even analysis to be useful.
With a temporary penetration pricing strategy, the price can be set higher but be careful not to rely on this long term.
At a certain number of sales, we break even.
Beyond this, we make a profit.

Can we compete for a large enough percentage of customers within the SAM?
Percentage of customers with no process / manual work.
Percentage of customers with their own custom process.
Percentage of customers using a third-party tool where:
We offer a competitive level of functional depth.
We offer a significant enough benefit for them to switch.
The ease and cost of switching is low enough.
Are the numbers in the break-even analysis calculations realistic?
External assessment
This relies on discussions with a sample set of customers that you think will buy from you. You should do this during the Experiment process stage. Avoid asking customers directly if they would pay a specific price. People often say yes, but do not follow through. Instead, validate the size and cost of the problem. If the customer agrees that the problem is significant and costly, your pricing can be justified against that evidence. Discuss the following with potential buyers and users (if a B2B product):
Problem size - Confirm the problem you are solving is big enough. For example, does this save them a lot of time and money?
Use cases - Record what the customer is doing. Record specific features used if working with a competitor’s product.
Positive forces that drive a customer to you:
Identify the most important things they can’t do or do well in their current solution.
Test solution desirability with lightweight UX. This can be done initially with wireframes. Ask them to rate what they have seen. Delighted will suggest they may pay.

Negative forces that drive a customer away from you:
Identify what they love doing in their current solution.
Identify any worries about switching to you.
Beta test sign-up
You should do this during the Experiment process stage. Offer a Beta test sign-up and see how many take this option.
Step 7 - Post-release price testing
It is better to spend time setting the correct price before you release. Changing prices after you release can have some bad consequences:
Raising prices - This can make your existing customers very unhappy as they have assessed value at a different price point. Additionally, new customers may have seen your previous prices and now consider you to be more expensive. This is known as an anchor price. It "anchors" the value of the product in someone's mind. Even if you underpriced originally to offer amazing value and entice customers, they may not recognise this and respond negatively when you adjust upwards.
Lowering prices - At its worst, this can make your existing customers who are paying more request refunds or churn.
Regularly changing prices - This can create uncertainty, and buyers may wait for a perceived "best price" that never arrives.
Monitoring changes
Monitor the new sales trend and revenue when you change your price. The increased sales revenue may make up for the reduced profitability.
Lowering prices - Consider a limited-time offer. This will give you feedback on the impact of a lower price without needing to permanently lower it. It can even buy you enough time to release new functionality.
Increasing prices - You can raise prices based on inflation but also where you offer more value.
Price modelling
Model price changes based on previous events. For example:
What impact did the last 10% rise have?
What impact did a competitor’s rise have on them?
Tracking prices
Regularly track prices so that you can react proactively. For example, if your competitor slashes prices by 20%, you should be ready to respond.
Process
Working with the canvas should be an iterative process, meaning you should build, test, and improve as you go. Avoid the “tick-box” mentality of quickly filling in the sections without much thought. The amount of product testing you do is always a balance. For well-understood products, you will do a lot less. This is in contrast to a new type of product aimed at disrupting a market, where extensive testing is vitally important.
The diagram below shows the process steps. Certainty is increased the further you go. Decision points stop you from completing expensive build work when the innovation idea is flawed. At the end of each step, a decision is made:
STOP - This idea won’t work and cannot be saved.
PIVOT - Change your solution or target customer group to achieve success.
CONTINUE - You make a decision to invest more.

Stage 1 - Structure
Stage objective - Shape the product idea to better understand it and its risks.
This stage should last around 2 weeks.
Stage activities
Creating the business model
Use the New Product Generator canvas to structure your business model. Doing some lightweight analysis up front is important. Focus on the information that is readily available. For example, you can easily research competitor products online, and your existing relationships with potential customers can provide early input. After you have filled in the canvas, you will identify assumptions that need testing. For example, you have assumed that your differentiators are important to customers, or even more fundamentally, you have assumed the customer’s problem is big enough to warrant a product. If you are rushing and mostly brainstorming canvas sections, you will need to test a great deal immediately. This is not an efficient approach. Additional guidance to make this stage more successful is provided below:
Guidance - User Experience Concept
It is strongly recommended that you create a basic visual design at this stage to:
Align the whole team on the product, including its high-level scope.
Ensure the product can be built and run (feasibility).
Confirm desirability with customers.
In software, the UX concept simulates the way the product works. These concepts are very powerful for reducing risk. Techniques for producing them are ordered by creation effort, from low to high. At this stage, wireframes are a good option:
Wireframes - These are a rough draft of your product’s design. Their key benefit is that customers will not evaluate the visual aspects but focus on the functionality.
Mockup - These are visually realistic product designs. Their key benefit is getting feedback on the product’s look and feel.
Prototypes - These are representations of how a user interacts with your product. They are typically high-fidelity and done with UX tools rather than code. Their key benefit is helping customers understand what the finished product looks and functions like.
Sketch.com have created this article to help you learn more about these.
Guidance - High-level service design
You will be making important decisions in the Key Service Design Decisions section of the canvas. For more complex or high-cost items, it is advisable to do lightweight design and research to firm them up. This may include desk research, internal stakeholder conversations, and discussions with a few key customers. Start with modelling how the service works. There are two key artefacts that can support this:
Customer Journey Maps are a visual representation of the customer’s touchpoints.
Service Blueprints extend these to show how the organisation works behind the scenes. It is very advisable to produce a high-level Service Blueprint.
As your design progresses, it may surface additional detail:
A better understanding of costs - Costs include setup and ongoing running. Run costs may be fixed or variable. As examples, a variable cost would be paying a % of every payment transaction, and a fixed cost could be the ongoing price of employing a support team.
Commercial viability - Offering 24/7 support with a dedicated team may sound good on paper, but you need to understand if it is commercially viable. It is not about avoiding costs but understanding them relative to the revenue they will generate. Some decisions can impact your pricing. For example, you may charge for a premium service. Here are some considerations:
Expected service - It is extremely important to consider if the service matches your customer’s expectations. For example, if your ideal customer expects premium support and you only offer an AI chatbot, they may reject your product. Be careful not to view service design as a pure cost-reduction activity.
Charging - You don’t have to give everything away for free. You may offer a paid premium service or include it in higher-priced tiers. For example, you offer a dedicated support agent for a fee. These decisions should reflect both the cost of delivery and the value to the customer.
Differentiation - Better service can drive increased sales and lower churn. In commoditised markets, such as households buying gas and electricity, this can be a primary differentiator.
Guidance - High-level technical design
With a visual product concept and an understanding of the service design, you can now create a view of the technical implementation. As you understand more, you may choose to iterate on or change your design. For digital products consider:
Architecture diagrams - A visual representation of the system's components and how they interact. Include the external systems, APIs, and third-party services your system needs to connect to.
Technology stack — The broad technologies, languages, frameworks, and platforms you will use.
As you create your design, consider the following feasibility criteria:
Team capability — Does your team have the skills required, or are there gaps to fill?
Costs and timescale — What is the high-level cost, and what is the order of magnitude for delivery — weeks, months, or years?
Identifying assumptions
Assumptions are best described as things you think you know but may be wrong about. The sentence starting “We believe that” sums this up. They can come from any of the parts of a canvas. For example:
Feasibility assumption - We believe that the business can support the new product without additional people.
Assumptions should be recorded where they are high impact:
Feasibility - Can it be built and run for a sensible cost? Here are some considerations:
Understanding of technical design, including the ability to build it and ensure it will scale to customer demand.
Understanding of service design, including the ability to run it and ensure it will scale to customer demand.
Understanding of any major risks that could lead to this failing or greatly increasing the cost.
Desirability - Do customers want this? Here are some considerations:
Evidence that it solves a big enough problem for customers.
Level of differentiation of your solution versus alternatives in the market.
Evidence that customers want your solution and will switch from current solutions.
Viability - Does the business case stack up? Here are some considerations:
Understanding of the pricing model and that the target price point is competitive.
Evidence that customers will pay.
Understanding of fixed and variable costs. These include building, customer acquisition and running the service.
How long it will take to reach the break-even point and then achieve a good Return on Investment (ROI) based on your expected demand.
Assumptions mapping below helps you identify their level of risk. This allows you to vary the amount of up-front testing. Where you have many large risks, you will do more. When prioritised, move them to the grid below and develop tests to remove them.

Creating tests for assumptions
Once assumptions are recorded, tests should be created to remove them. For example, you may not be sure if a new server architecture will be performant (feasibility) and want to run a 3-day spike. If you can’t easily test them, you can leave them for later build stages. In the unusual case you have no testing to do, move straight to the Validate stage. Here are some example tests you can run:
Desirability tests - Visual tests with customers and internal stakeholders using wireframes, mockups and prototypes.
Technical tests:
Spikes - These are timeboxed tests with a clear purpose. For example, you may not be sure if a new server architecture will be performant (feasibility) and want to run a 3-day test. You can extend the spike if it makes sense. Consider these when you have specific areas of high risk.
Proof of Concept (POC) - These are more comprehensive than spikes and demonstrate that your technical solution will work. It can also help validate costs. They are rarely shown to customers. Consider these when you have a high-risk build, such as when working with several new technologies. Your POC’s purpose and scope should be very tightly defined, or you will find testing will last a very long time.
Stage outputs
A first version of the New Product Generator Canvas.
The assumptions testing grid below:
Prioritising assumptions for testing - It is highly advisable to prioritise desirability and viability testing. Desirability - If a customer doesn’t want your solution, then don’t waste time trying to build it. Viability - Are they prepared to pay for it, and can they afford it?
Overall Experiment stage estimate - Time for tests plus feedback. Consider building a simple plan here. For example, 5 days of testing are required for one feasibility test and two desirability tests. Then, make time for improvements based on feedback.

End of stage decision point
Should we continue, pivot our idea or stop?
Desirability - Do we believe customers want this?
Feasibility - Do we believe we can build and run this?
Viability - Do we believe the business model can deliver sufficient return to justify the investment?
Overall - Does the idea still make sense?
Stage 2 - Experiment
Stage objective - Improve the innovation idea by running tests to remove risks.
At the end of this stage, you should have removed a lot of risk and gained more confidence in the idea. As you gather the results of the tests, you should refine your canvas. Don’t be afraid to pivot or even stop early if the idea won’t work.
Stage activities
Run the assumptions tests, evaluate the results and respond to them. For example, look at other options if a technical design doesn’t work well. If a test completely fails consider an early review meeting.
Stage outputs
Results of assumptions testing:
An updated version of the New Product Generator Canvas and Business Model Canvas (if you are using this).
Updated design artefacts.
Plan for the Validate stage - You will build a Minimum Viable Product (MVP):
Have clear goals - Objectives and Key Results (OKRs) are recommended for this (see example below).
Any outstanding assumptions that need testing.
Identify high-level MVP scope - This includes the features you will build. Consider story mapping for this.
More detailed technical and service design.
Rough build estimate - This can be ranged. For example, 8 to 10 weeks.
Example OKRs for MVP build (next stage)
Objective - Validate the product is good enough for customers to buy it
Key Result 1 - Ten customers who are likely to buy signed up by January 2026 - Stretch target
Key Result 2 - Less than three support calls per week by June 2026 - Stretch target
Key Result 3 - Seven out of ten delighted by the product by June 2026 - Stretch target
“Stretch target” is used where you cannot guarantee the result.
End of stage decision point
Should we continue, pivot our idea or stop?
Desirability - After testing, do we have good enough evidence customers want this?
Feasibility - After testing, do we have good enough evidence we can build and run this?
Viability - After testing, do we have good enough evidence we will achieve sufficient benefits to justify the investment?
Overall - Did any tests fail or expose too much risk in any of these areas?
Stage 3 - Validate
Stage objective - Early validation of the product in the market with customers.
In this stage, you will build a Minimum Viable Product (MVP). The MVP is a basic version of the product containing just enough functionality to solve the customer’s problem(s). This is used to validate the idea in the market with minimal investment, where there is significant uncertainty about market fit.
Stage activities
Create the MVP and test it with internal stakeholders and a limited number of customers:
Remove remaining high-risk assumptions.
Detailed technical design to support full production release.
Detailed service design to support customers using the product.
Identify or create the teams that need to support the solution.
Create a detailed backlog for the MVP.
Build the MVP - Track progress and manage risks and issues.
Optional Alpha Testing - Launch to internal stakeholders to gather feedback and improve the product.
Go-to-market activities - Launch to a limited set of customers to gather feedback and improve the product.
Stage outputs
MVP built, released and supported.
Results of MVP testing (OKRs).
An updated version of the New Product Generator Canvas and Business Model Canvas (if you are using this).
Capture improvements required to the product and live service.
Plan for the Market stage - You will release the full product:
Have clear goals - Objectives and Key Results (OKRs) are recommended for this (see example below).
Finalised technical and service design.
Finalise high-level scope - This includes the features you will build. Consider story mapping for this.
Identify required go-to-market artefacts.
Rough build estimate - This can be ranged. For example, 10 to 12 weeks.
Example OKRs for marketable release (next stage)
The next stage is a full release to customers. This should be more functionally rich than the MVP. You can still run a limited rollout of the full product. For example, you create a release only for customers in Scotland. This will represent less risk but still allow you to get real-world feedback. You can then scale the product up when you have optimised it. An example OKR for the market stage is below:
Objective - Confirm product viability
Key Result 1 - Fourteen sales in Scotland by June 2026 - Stretch target
Key Result 2 - 100% of new customers use the app each day (Mon to Friday) by Jan 2026 - Stretch target
Key Result 3 - Quarterly Customer Satisfaction Score (CSAT) over 6 out of 10 by June 2026 - Stretch target
Key Result 2 is a leading indicator for desirability, it tells me that the product is being used. If it wasn’t, you are unlikely to see good CSAT score. This means I can react faster to unhappy customers than waiting a quarter for feedback. “Stretch target” is used where you cannot guarantee the result. I don’t know if my CSAT will be over 6 but I will aim for this.
End of stage decision point
Should we continue, pivot our idea or stop? Do we have strong enough evidence that:
Desirability - Customers want this?
Feasibility - We can build and run this?
Viability - Do we believe the business model can deliver sufficient return to justify the investment?
Overall - This is worth taking to market?
Stage 4 - Market
In this stage, there can be a lot to do. You will have to build your product in full and get your service ready to support potentially large numbers of customers. This service can include sales, marketing and product distribution. If you are an existing organisation, you will likely have processes for this already. You can use your existing governance structures to take the product live.
Stage objective
Produce the first version of a functionally complete working product that you can market to customers. The customers should be able to buy the product at this stage.
Stage activities
Create the full product for customers:
Finalise technical design.
Finalise service design.
Finalise the teams that need to support the solution.
Create a detailed backlog for the final product.
Build the full release version of the product - Track progress and manage risks and issues.
Consider your brand strength using the Brand Equity section of the Market Positioning Canvas.
Optional - Launch to internal stakeholders / a smaller group of customers to gather feedback and improve the product.
Go-to-market activities - Publicly launch to customers.
End of stage decision point
Based on the OKR results, should we continue, pivot our idea or stop?
Stage 5 - Post-market improvements
Your product should be in the market and ready for incremental improvements at this stage. Follow the Commercial Agile Framework to decide on your next strategy. Start by creating the Market Positioning Canvas, then look to define your next Strategic Direction.
Product definition
In this canvas section, you are defining your overall product offering and will:
Consider building barriers to entry into your offering.
Capture the key features of your product and how other product differentiators can help you win, e.g. usability, security.
Capture the key service design decisions of your product.
Create a differentiation strategy and test it.
Decide how you will build your solution (technical design).
Given the canvas size, this section will contain very brief summaries and should be augmented with design documentation. In the early stages, you should be designing at a high level. As you get closer to the full release, more details will be required. Pay particular attention to aspects that are high-risk. For example, if you have a manual security clearance process that could derail your entire product. The section is deliberately lightweight. Technical and service design are very large subjects. It is highly advisable for experts in these domains to be part of the innovation team.
Costs and viability
When making any decisions, view these through a cost lens. In the pricing section, you will consider costs in more depth, but you should not ignore them here. A high-level view and viability assessment are needed. For viability, you need to ensure your revenue covers the costs. For example, you decide to offer 24/7 support. If you need to charge more for this, is it realistic that your ICP will pay?. You cannot simply list many differentiator features without understanding the cost of creating and supporting them, as this can result in a product that is never delivered or is unprofitable.
New organisations
If you are creating a start-up and don’t have an existing organisation to rely on, you can find significant complexities in launching. These include diverse requirements, such as regulatory requirements and disaster recovery. The details below are provided as a starting point. It is highly recommended that you bring experts in to confirm you are ready to go to market. Run as lean as you can at this point. For example, you may not need to create a full support team and process if you only have a few customers.
Creating barriers to entry
Barriers to entry are attributes that make it hard to create a new profitable product. In this context, you are looking to make it hard for competitors. This can be particularly important in new markets with little competition. These can be very profitable, and stopping or slowing competitors from entering them is wise. As part of the solution definition, consider each of these barriers and see if you can incorporate them into your offering. For example, it may be easy to offer long contracts. You should still consider viability. For example, adopting limit pricing will significantly impact your profitability. There are two types of barriers to entry:
Strategic barriers are deliberately created by businesses to deter competitors. They are actions you choose to take, such as locking customers into long contracts or pricing aggressively. You have control over whether to implement them.
Structural barriers exist because of the nature of the market or industry itself. They are not deliberately created to block competitors but arise from the characteristics of operating in that market, such as economies of scale or network size. These are harder to deliberately create, but understanding them helps you assess your natural advantages and recognise what will work in your favour over time.
Strategic barriers
High switching costs - When the cost to switch from a solution is very high, it puts customers off.
Contracts - Long contracts can make it hard to gain new customers.
Limit pricing - Deliberately setting a low price so that competitors cannot make a profit. This is combined with lower costs to avoid incurring a loss. You run this for as long as it takes to drive a competitor out of the market.
Brand - Strong brand loyalty can be a significant barrier to entry as customers will even pay more for one they trust. Brand strength can be improved using the Brand Positioning Canvas.
Advertising costs can be much higher to increase brand awareness than for an established competitor.
Loyalty schemes - Offering discounts for staying with a product.
Patents and licenses - These can prevent competitors from replicating key functionality, forcing them to find alternative approaches or invest heavily in workarounds.
Structural barriers
Economies of scale - Significantly lower cost per unit due to a large-scale operation. This can be due to lower operational costs, technology efficiency, and logistics.
Network effects - The product gets more valuable as more users join, making it difficult to convince customers to switch.
Established relationships — In many markets, particularly B2B, buying decisions are influenced by existing trust and personal access to decision-makers. This builds naturally over time as you work with more customers. New entrants without these relationships face longer sales cycles and lower conversion rates.
High set-up costs - When the initial investment is very high, the new entrant must have enough money to fund this. An example of this would be research and development.
Feature/service parity - Where all major competitors offer the same set of core features or service level, it is advisable to match these. With features, as customers become more familiar with mature solutions, their expectations will grow. Imagine a car without adjustable seats.
Ownership of raw materials - The owner of raw materials, who can either block competitors from purchasing or raise their prices, meaning they cannot compete.
Regulatory and compliance — Some industries require certifications, licenses or regulatory approval before you can operate. These create barriers through cost, time and expertise. Achieving compliance early slows competitors who have not yet invested, and even if not a prerequisite, some customers will not buy without it.
Key product features
Minimum product depth
A common anti-pattern with product development is to put out a product that is too small by rushing. Even the most basic product must solve a problem for a customer. Too little functional depth, and they will reject you regardless of price. Imagine buying a fridge that doesn’t cool down properly.
Creating something new can be time-consuming. For example, in mobile development, releasing a substandard product carries a huge risk. Customers can delete your app and never come back. This means your “live testing” is actively damaging your future sales. These people may then tell others that you have a poor product, doing even more damage. It is important to note that this does not stop you from validating your ideas with prototypes or doing small-scale targeted testing.
Low-cost product
The picture below shows two features with just enough functional richness to satisfy the customer. This situation is typical with a low-cost product. Anything less than this and the customer will probably not buy from you, or if they do, you will see very low satisfaction scores.

Key service design decisions
A product will need to be supported. This can include aspects like set-up, error handling and manual processes. The canvas should include major service decisions, e.g. 24/7 support with a dedicated team, self-service setup with online training. The details behind how these work should be done separately. There are two very useful tools for designing how a customer will interact with the organisation:
Customer Journey Maps are a visual representation of the customer’s touchpoints.
Service Blueprints extend these to show how the organisation works behind the scenes. It is very advisable to produce a high-level Service Blueprint.
Service considerations:
System set-up, e.g. consulting services and training.
Live Service Support, e.g. support team readiness, support team hours and SLAs.
Communication, e.g. feedback mechanisms, launch announcements and system problem updates.
Security checks, e.g. verification and fraud detection.
Payment, e.g. taking payments and disputes.
Error handling, e.g. support for failed processes.
Legal, e.g. terms of service and liability.
Data privacy, e.g. regulatory compliance.
Team design to support the new service.
Service partners:
You may decide to use partners to support the service, including:
Technology — e.g. hosting, integration.
Sales — e.g. resellers.
Distribution — e.g. delivery partners.
Marketing — e.g. agencies.
Regulatory and compliance — e.g. legal advisors.
Investment — e.g. funding partners.
Introduction to service differentiators
Like we considered feature differentiation, we can also apply service differentiation. For example, 24/7 support with a dedicated team. You should be aware of your competitors and ensure that you understand the costs of anything you offer, to ensure it is commercially viable.
Deciding on differentiators
Differentiators are not about creating a long list of the differences between products, but the differences that customers care about:
You may need to conduct customer research to confirm them.
Messaging these clearly is very important, ensuring you stand out in the market. Avoid filling up your marketing and communications with information that detracts.
Avoid focusing customers on differentiators that can be easily replicated by your competition.
Although pricing can be used as a differentiator, this can be a “race to the bottom” as competitors reduce prices to match you, and everyone sees reduced profitability.
Differentiators are not just feature-based. For example, you offer a superior setup experience.
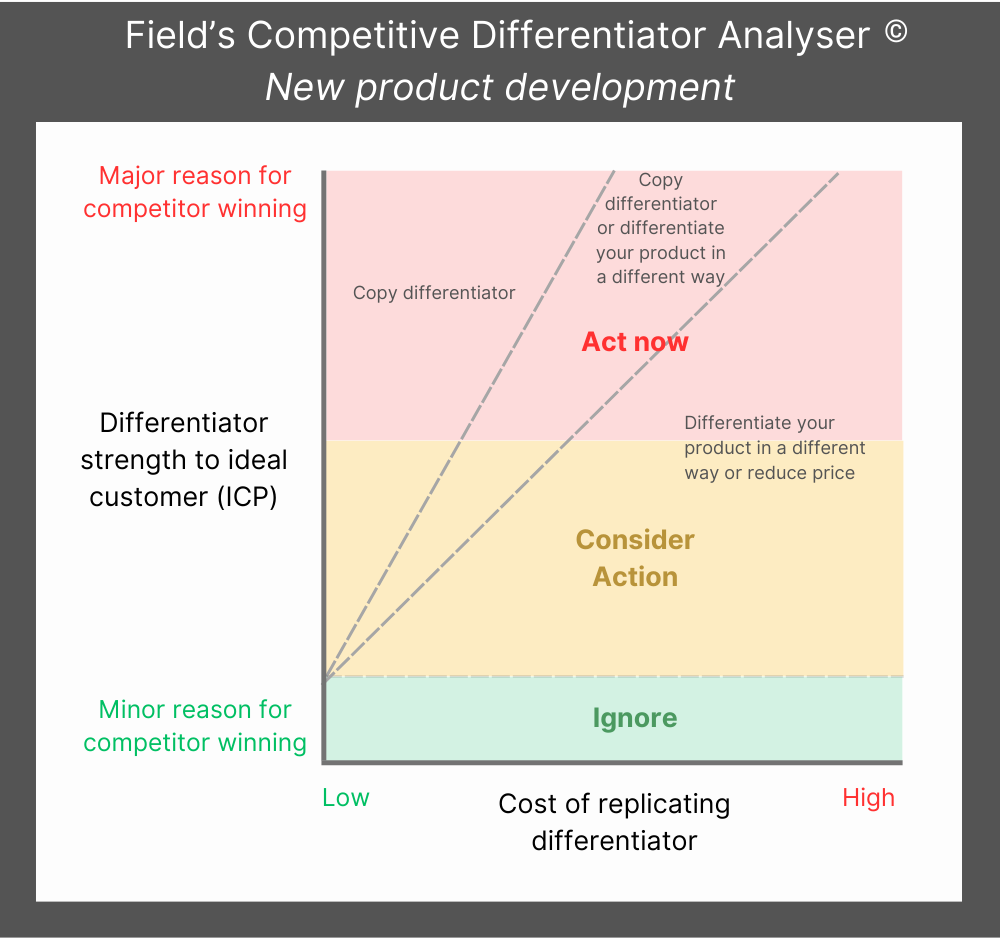
Analysing and responding to competitors
The Field’s Competitive Differentiator Analyser gives you a structured way of analysing and responding to each of your competitors’ differentiators. You may be mapping multiple competitors here. For each, you will need to understand why each competitor is winning. You must not assume all claimed differentiators are the reasons why. Your competitor may not have optimised its messaging and may be promoting things that customers don’t care about. Some established products will be very large, and you may not be able to compete without a huge investment. In this case, you should consider a simpler product with unique differentiators and perhaps a lower price.
Mapping exercise - When ready, select a competitor and map each differentiator on the graph. Start with features, then move to the other factors such as security. Using a security example, you map the cost of replicating their certified ISO level.
Response to differentiators - You will now have a complete picture built up and can consider your actions:
Nullifying differentiators - Prioritise removing competitive advantage where it is easy to copy.
Create new differentiators:
You may find that a competitor is winning because of several differentiators that you cannot easily copy. You don’t need the same number of your own differentiators to match them. One may be enough. For example, they have three strong functional differentiators that are hard to copy, and you decide to differentiate your product on usability.
It is advisable to create your own differentiation regardless of the competition’s strengths.
Lowering price - This option can be used as a primary differentiator or combined with other differentiators. Be cautious with this strategy as it can trigger a price war if you go too low.
Testing your new differentiators
To ensure your customers care about the differentiators you have selected. Instead of showing them the differentiator and asking what they think of it, consider how big a problem this differentiator solves. For example, if your competitors have very poor usability, many new customers may be expressing significant public frustration. Below shows a very simple visual example of differentiation with product features.
Technical design overview
You should have separate technical design documents. This design can require a lot of analysis depth. The section on the canvas is for capturing key decisions.
Build or buy decisions for software
As you progress your technical design, you may come across the build or buy decision many times:
When to Buy - Buying is better suited to standard functionality that does not differentiate your product. For example, a diary system where building your own would be expensive and provide no competitive advantage. Buy includes commercial products, SaaS, and open source. With open source, you get the benefits of “buy” without the cost of building. Open source removes licence costs but introduces its own costs: integration, maintenance, keeping up with updates, lack of vendor support, and the risk that the project gets abandoned.
When to Build - Build where the capability is core to your competitive advantage, or where no existing solution meets your requirements. Building gives you full control but demands more time, cost, and ongoing maintenance.
Software technical design considerations
There are many considerations when designing software products, including:
Infrastructure, e.g. live and test environments.
Testing, e.g. smoke test packs and rollback strategy.
Performance Testing, e.g. volume, load and stress tests.
Legal, e.g. storage of personal data.
Security, e.g. penetration testing strategy.
Observability, e.g. error logging.
Disaster recovery, e.g. data loss, system downtime, cyberattack.
System migration, e.g. from previous product versions or competitor products.
Cost optimisation, e.g. using the cloud for scaling.
Development team design.
Skills required, particularly if in new technologies.
Future ability to support the product if few people have the required skill set.
Matching competitors
On top of a basic product, customers’ expectations are also based on the competition. If all competitors offer certain features, many will become expected. For example, you don’t need electric windows to use a car, but these are now considered a must-have. This means that creating products without any competitor analysis can create a massive risk to success. The size of the minimum required product increases:

Introduction to product differentiators
Differentiators allow you to stand out in the market and can help you avoid a price war. If pricing is your only differentiator, this can be a “race to the bottom”, as competitors reduce prices to match you, and everyone sees reduced profitability.
Functional differentiators
Functional differentiators can be:
Additional functional depth within a feature (FT2).
Additional feature(s) (FT3).

Other product differentiators
Beyond functional differentiation (features and feature depth), other aspects can have a very high impact. For example, imagine that your competitor’s product is highly functional but extremely hard to use. You may be able to differentiate on usability. Below are some other important aspects you should consider:
Usability
Performance
Security
Customisation
Integration/ecosystem
Data and insights
Stability
Target market and channels
In this canvas section, you will:
Define your Ideal Customer Persona.
Make sure the target market isn’t too large and competitive to make a profit.
Make sure the target market isn’t too small to expand into.
Define the channels for customer awareness, purchase and delivery.
Why have a target market?
What happens if we target a product at everyone? We can get radically different requirements, a bloated product and confusing feedback. You will find tools to model your target customers for B2C (business to customer) and B2B (business to business) at the bottom of this page.


Ideal Customer Persona
A single Ideal Customer Persona (ICP) representing similar customer needs will give your product clear direction. Selecting the right ICP to match your offering will also help you achieve the highest potential revenue. This is because when a product meets customers’ needs, they are more likely to buy it. With a new product, you will be testing and improving your ICP.

ICP selection during growth cycle stage
Start – Optimise your ICP definition
Growth – Prioritise a single ICP
Scale – Consider changing your ICP as the market becomes saturated
Maturity – Change your ICP to continue to grow
Tiered subscription-based pricing
In the case where you have a tiered pricing strategy, you may have specific tiers targeted at different customer groups. For example, you have a cheaper pricing tier for more price-sensitive customers or those with a simpler use case. In new product development, it is advisable to keep this simple. Although you could immediately go broad, this may slow you down.
Market size and Ideal Customer Persona
Customer personas can help us model our target customers. These will differ based on selling directly to customers (B2C) or to businesses (B2B). In B2B sales you can have the additional consideration of numerous people involved in the buying process. For example, representatives from finance and technology. The templates below show you how to model the ICP and buyers. Additionally, the canvases contain information on market size considerations.
B2C Customer Persona
Customer personas can help us model our target customers. Where a business sells directly to customers (B2C), the product user is typically the person who is buying. Click the persona picture or this link for the full guide.

B2B Company Profile
Where a business sells directly to other businesses (B2B), they need to profile the type of company they are selling to. Click the picture or this link for the full guide.

B2B Buyer Persona
Where a business sells directly to other businesses (B2B), there can be a variety of people involved. The product user may not even be involved in the buying process. Click the persona picture or this link for the full guide.

Channels
Once we have identified our customers, we must decide how to interact with them. Below are some considerations.
Awareness
How do they find out about the product?
Online marketing - For example, social media, working with influencers and websites.
Advertising - For example, Television, radio and Google Ads.
Public relations - For example, media coverage and industry events.
Partnerships - Working with complementary organisations.
Referral programs - For example, affiliate marketing and cash back for referring friends.
If your brand is new, you should consider following the comprehensive advice in the Marketing Positioning Canvas.
Purchase
How do they buy your product? For example:
Through your website or app — The customer purchases directly from you online.
Direct sales — A sales team engages with the customer to close the deal.
Partner or reseller — A third party sells your product on your behalf.
Marketplace — A third-party platform such as Amazon, App Store or an industry-specific marketplace.
Physical location — For example, a retail store or trade show.
Delivery
Digital products — How does the ICP receive the product, and who sets it up? Examples:
Self-service — The customer signs up and configures it themselves.
We set it up — Our team handles onboarding, configuration or data migration.
Partner sets it up — Sold or delivered by a partner who handles the rollout.
Physical products — How do you deliver the product to them? Examples:
Shipping.
We deliver and install.
Pick-up.
Competition and barriers to entry
In this canvas section, you will:
Identify your competition’s offerings.
Evaluate the health of your competitors.
Understand their product’s strengths and weaknesses.
Consider the market’s barriers to entry to ensure you can compete.
Competitor types
Capture competitors and their products that you will go up against. You can also consider those you should monitor. By profiling your competition, you can:
Understand the size and maturity of current offerings to evaluate the effort required to compete.
Probe for strengths and weaknesses to gain a competitive advantage.
Replacement competitors
A market can decline when a competitor releases a new superior product type. It is most important to be aware of these competitors. For example, where Blockbuster’s DVD rental business was replaced by video streaming. STOP - In this case, you should immediately consider your approach and potentially stop development. This is why this is not a section on the canvas.
Direct competitors
Direct competitors are those competing for sales with similar products and target customers. You should pay particular attention to those with the following factors:
Have a significant market share.
Show major market growth.
Competitors to monitor
It is important to understand that different customers have different needs. If you are selling a high-priced premium product to a customer who has a basic use case, it is unlikely to work. Competitors targeting different types of customers should not be viewed as a problem. Typically, you won’t respond to them, but you may look at their product development for new ideas.
Monitor other competitors that:
Have high levels of innovation that you can copy.
May be growing and eventually start to compete with you.
May be looking to pivot into your market.
Competitor offering
Use the Competitor Threat Analyser Canvas (full details in the link) to evaluate each competitor. This will help you understand the differentiators that help them win and also why they lose. You don’t need to consider the sections for your own wins and losses at this stage.

Competition’s barriers to entry
Barriers to entry are attributes that make it hard to create a new profitable product. In this context, you are looking at your competitors. At their worst, these can stop your product entirely. In this case, you must nullify or work around them. If you cannot, you may have to stop development on this product. There are two types of barriers to entry:
Strategic barriers are deliberately created by businesses to deter competitors. They are actions your competitors chose to take, such as locking customers into long contracts or pricing aggressively.
Structural barriers exist because of the nature of the market or industry itself. They are not deliberately created to block competitors but arise from the characteristics of operating in that market, such as economies of scale or network size. These are harder to counter. For example, a competitor may have set significantly lower prices by leveraging its economies of scale.
Strategic barriers
High switching costs - When the cost to switch from a solution is very high, it puts customers off.
Contracts - Long contracts can make it hard to gain new customers.
Limit pricing - Deliberately setting a low price so that competitors cannot make a profit. This is combined with lower costs to avoid incurring a loss. This is run for as long as it takes to drive a competitor out of the market.
Predatory pricing - Pricing below cost to force competitors out of the market. This may violate antitrust laws in many jurisdictions, but proving it is difficult.
Brand - Strong brand loyalty can be a significant barrier to entry as customers will even pay more for one they trust. Advertising costs can be much higher to increase brand awareness than for an established competitor.
Loyalty schemes - Offering discounts for staying with a product.
Patents and licenses - These can prevent competitors from replicating key functionality, forcing them to find alternative approaches or invest heavily in workarounds.
Structural barriers
Economies of scale - Significantly lower cost per unit due to a large-scale operation. This can be due to lower operational costs, technology efficiency, and logistics.
Network effects - The product gets more valuable as more users join, making it difficult to convince customers to switch.
Established relationships - In many markets, particularly B2B, buying decisions are influenced by existing trust and personal access to decision-makers. This builds naturally over time as you work with more customers. New entrants without these relationships face longer sales cycles and lower conversion rates.
High set-up costs - When the initial investment is very high, the new entrant must have enough money to fund this. An example of this would be research and development.
Feature/service parity - Where all major competitors offer the same set of core features or service level, it is advisable to match these. With features, as customers become more familiar with mature solutions, their expectations will grow. Imagine a car without adjustable seats.
Ownership of raw materials - The owner of raw materials, who can either block competitors from purchasing or raise their prices, meaning they cannot compete.
Regulatory and compliance - Some industries require certifications, licenses or regulatory approval before you can operate. These create barriers through cost, time and expertise required before you can enter the market. Some customers will not buy from providers without specific certifications.
Data advantage — Some products depend on accumulated data to deliver core functionality, such as real-time traffic routing, fraud detection or industry benchmarking. The more data gathered over time, the better the product performs. A new entrant cannot replicate years of accumulated data, making it difficult to match product quality from launch.
Reducing innovation risk
This section covers:
Reducing the risk of entering a market - The different risks based on the market’s maturity.
Reducing risk in existing organisations - How to select innovation that carries less risk.
Reducing delivery risk in existing organisations - How to be more efficient when delivering innovation.
Reducing the risk of entering a market
A radically disruptive product is one reason for the creation of a new market. Consider the move from horse and cart to the car. More competitors will join until, eventually, that solution is replaced or significantly improved. Risks change as the market gets more mature. Understanding the market’s maturity stage can help you reduce risk:

New market risk
Strategies to reduce risk (these are built into the process provided):
Engage potential early adopters to determine interest.
Validate demand by releasing a small product to a real customer.
Entering mature or saturated markets
Strategies to reduce risk:
Smaller release:
Better serve niche customers where their needs are neglected. This can help you avoid needing a very large product that will be expensive and slow to release.
Having a simpler use case at a lower price where there is lower competition. Not all markets will have this opportunity.
Set an initial low price that may lead to a loss in order to gain market share. When you have sufficient traction, you can raise prices.
Use extensive (and potentially expensive) advertising and marketing to create an established brand.
Risk reduction summary - Adapt your product and entry strategy based on the maturity of the market you are entering. Stop if the risk versus reward is too low.
Reducing risk in existing organisations
The Ansoff matrix is a useful tool for understanding strategy and how existing organisations can lower their risk of failure. There are four different expansion strategies an organisation can take:

Market development - Reduce risk by finding new customers that are the same or very similar to existing ones. For example, being in a different country. Risks tend to come from new competitors and new regulatory requirements.
Product development:
Reduce risk by releasing similar products to those you know.
If you are responding to a radically disruptive product, you can utilise your existing customer relationships to gain a competitive advantage.
Diversification - This can be a high-risk strategy. Use the market development and product development risk reduction strategies together.
Risk reduction summary - Use your organisation’s strengths to reduce innovation risk.
Reducing delivery risk in existing organisations
Reduce innovation delivery risk in existing organisations by:
Removing the blockers to innovation from your teams.
Making time for your teams to succeed.
Avoiding expert innovators handing over the work to build teams.